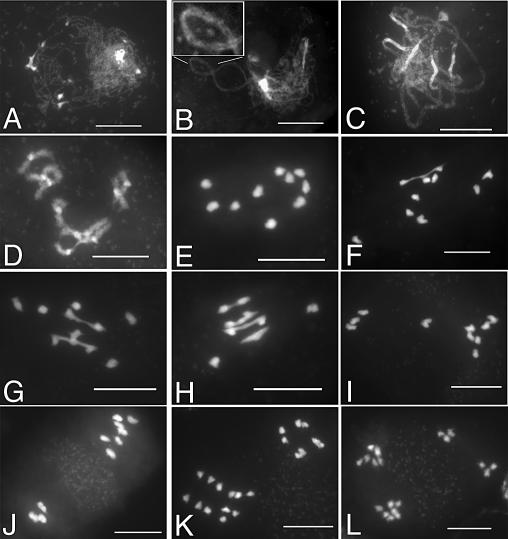
Figure 4. DAPI Staining of Atzip4-1 PMCs during Meiosis.
(A) Leptotene, (B) zygotene: The synapsed portion of (B) has been magnified and is presented in the boxed area of the figure. (C) Pachytene, (D) diakinesis, (E–H) metaphase I, (I) anaphase I, (J) metaphase II, (K) anaphase II, (L) end of meiosis.
Bar, 10 μm.

