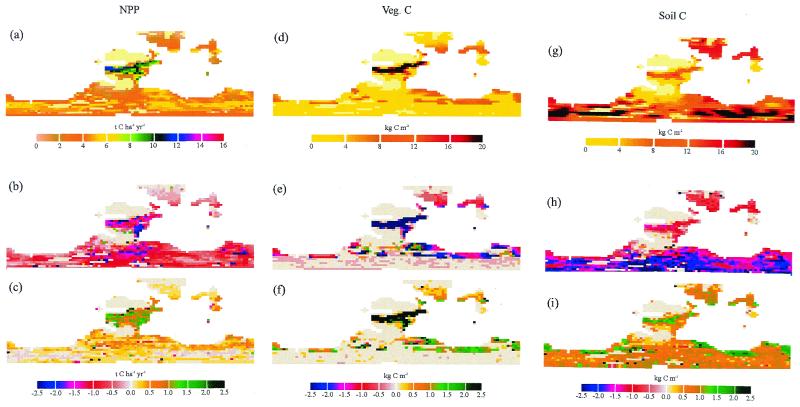
Figure 1.
Global distribution of NPP (t C per ha−1⋅yr−1), vegetation biomass (kg C per m−2), and soil carbon concentrations (kg C per m−2) in the late Carboniferous for the atmospheric composition represented by the control case (21% O2, 0.03% CO2; a, d, and g, respectively), and the modeled effects of the Permo-Carboniferous pO2 increase at two different pCO2 levels, given as the difference between case 2 (35% O2, 0.03% CO2) and the control (b, e, and h) and between case 4 (35% O2, 0.06% CO2) and the control (c, f, and i). Note that maps b, c, and h as well as c, f, and i are difference maps and are plotted on different scales. Each individual map shows the three major landmasses of the land-sea mask used in the climate and vegetation modeling. These were Gondwana, dominating the Southern hemisphere; Eurasia, the largest Northern hemisphere landmass; and adjacent to this landmass, Kazakhstan.

