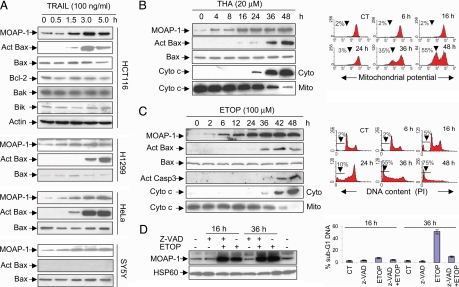
Fig. 1.
Apoptotic stimuli up-regulate MOAP-1 protein during the early phase of apoptotic signaling. (A) Levels of endogenous MOAP-1 protein were rapidly up-regulated by TRAIL. The indicated cells were treated with TRAIL for various periods of time. RIPA lysates were subjected to IP with the rabbit anti-MOAP-1 antibody (R5), followed by IB with the mouse anti-MOAP-1 antibody (M6). Actin was used as an internal control to demonstrate that equal amount of total proteins was used for IP. The levels of Bcl-2, Bak, and Bik in the total lysates of HCT116 cells were also measured with their respective antibodies. Bax activation (Act Bax) was monitored by using a conformation-specific Bax antibody (N-20). (B and C) Induction of MOAP-1 by THA and ETOP occurred during the early phase of apoptotic signaling. HCT116 cells (B) or 293T cells (C) were treated with 20 μM THA or 100 μM ETOP, respectively, for the indicated periods of time. MOAP-1 levels, Bax activation (Act Bax), Capase 3 activation (Act Casp3), and Cyto c release were monitored (B and C Left). For detection of Cyto c release from mitochondria, the cells were fractionated into heavy membrane fractions enriched with mitochondria (Mito) and cytosolic (Cyto) fractions. THA-induced mitochondrial depolarization (B Right) or ETOP-induced DNA fragmentation (C Right) were analyzed by flow cytometry as described in Materials and Methods. Data shown are representative of at least three independent experiments. (D) Caspase inhibition fails to suppress the elevation of MOAP-1 protein induced by ETOP. 293 T cells were pretreated with 10 μM z-VAD for 1 h before being subjected to 100 μM ETOP treatment for 16 h or 36 h. (Left) MOAP-1 levels were analyzed as in A. (Right) DNA fragmentation was analyzed as in C. Results are presented as percentage of apoptotic cells (mean ± SD, n = 3).

