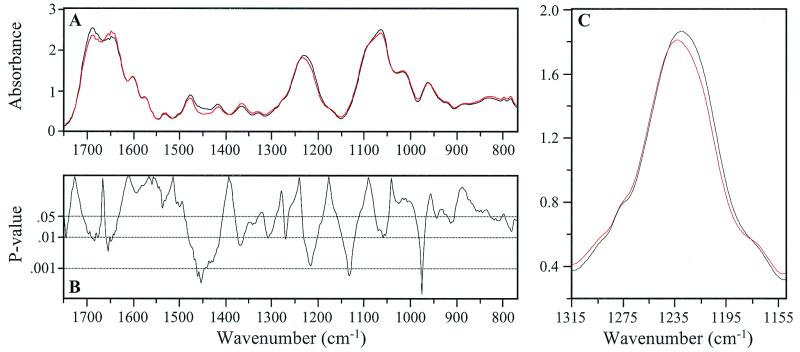
Figure 2.
(A) Mean IR spectrum of 5′-GAAGACTAATTGAGAGGATTAACTG-3′ (black) is compared with the mean spectrum of the 5′ (13) Ao derivative (red). (B) P values from an unequal variance t test between these spectra are depicted. Detail of the band assigned to antisymmetric stretching vibrations of the PO2- group shows the + 3 wavenumber shift in the 1,233 cm−1 peak occurring in the Ao derivative compared with the parent (C). Note the significant number of spectral areas with P < 0.01.

