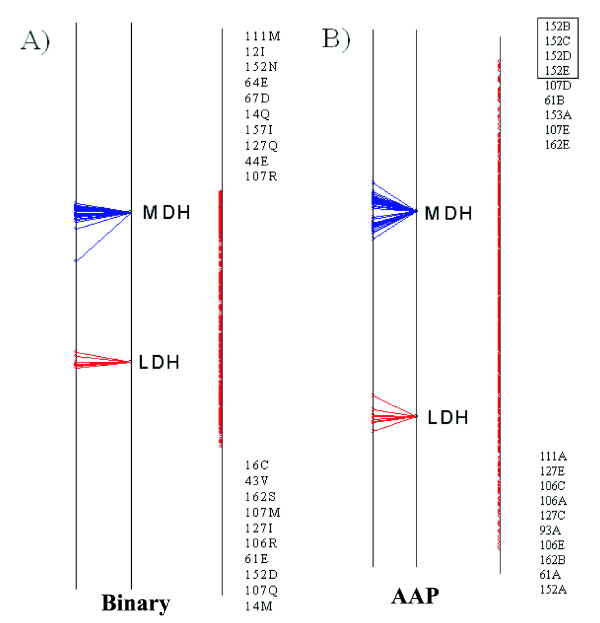
Figure 4.
Axis 1 of the Between Group Analysis for the Lactate/Malate Dehydrogenase test case using the binary encoding (A) and the AAP encoding (B). In each example the sequence split is shown on the left, the residues are plotted on the right. The top 10 residues at either end of the axis are shown. Any residues that are plotted at the same coordinate are enclosed in a text box. Each variable consists of a number, which is the alignment position, followed by a residue type or factor, depending on which encoding system was used.

