
Figure 1.
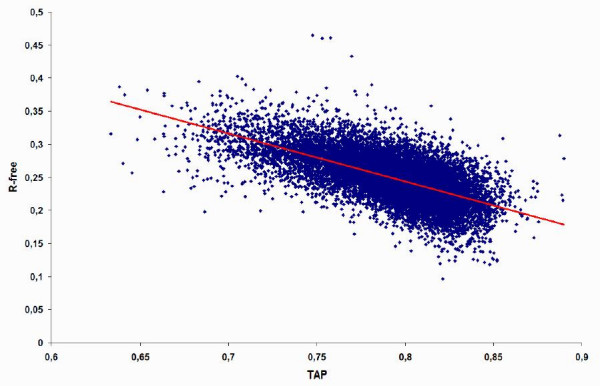
TAP-10 vs. R-free scatter plot on the all PDB set. The distribution of TAP score vs. R-free is shown for 13,691 structures in the all PDB set, together with the corresponding linear regression (red line). The correlation coefficient is -0.652.