
Figure 5.
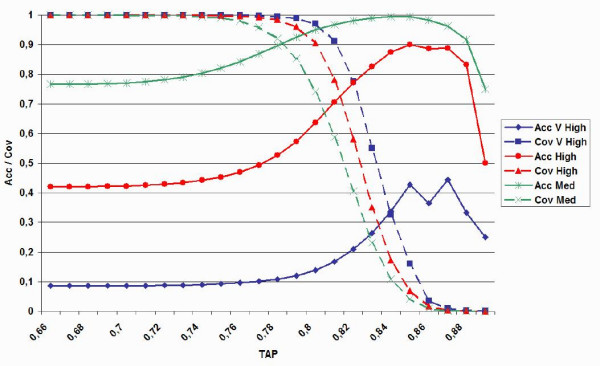
Accuracy and coverage plot for TAP score on the all PDB set. Accuracy (acc) and coverage (cov) are plotted for three experimental quality classes (medium, high, very high) as a function of TAP score threshold.
Official websites use .gov
A
.gov website belongs to an official
government organization in the United States.
Secure .gov websites use HTTPS
A lock (
) or https:// means you've safely
connected to the .gov website. Share sensitive
information only on official, secure websites.
Accuracy and coverage plot for TAP score on the all PDB set. Accuracy (acc) and coverage (cov) are plotted for three experimental quality classes (medium, high, very high) as a function of TAP score threshold.