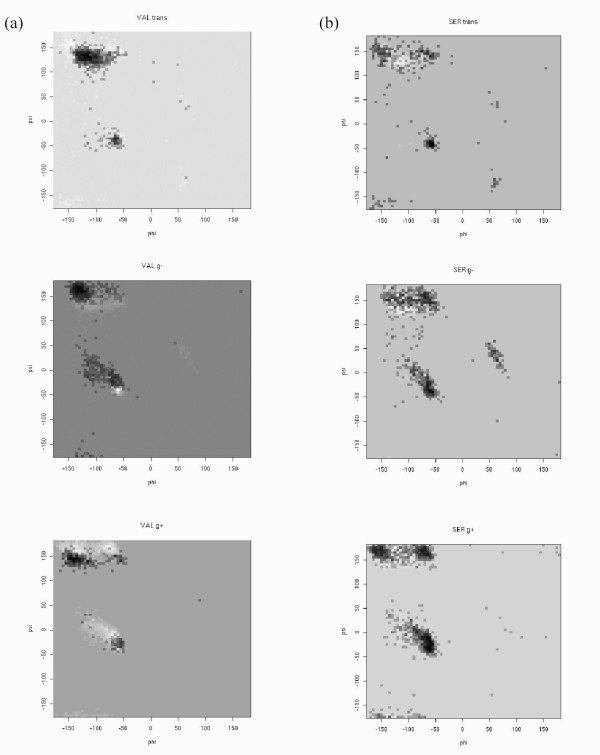
Figure 6.
Ramachandran plot of valine (a) and serine (b) residues. In each plot, the χ1 torsion angle is fixed at a rotamer position (trans, g-, g+) and the (φ,ϕ) TAP score landscape (resolution 5° × 5°) is plotted from white to black. Darker colours represent higher (i.e. better) TAP scores. Note that the less favoured regions are those where a given residue is less frequently present than the average of the twenty types.

