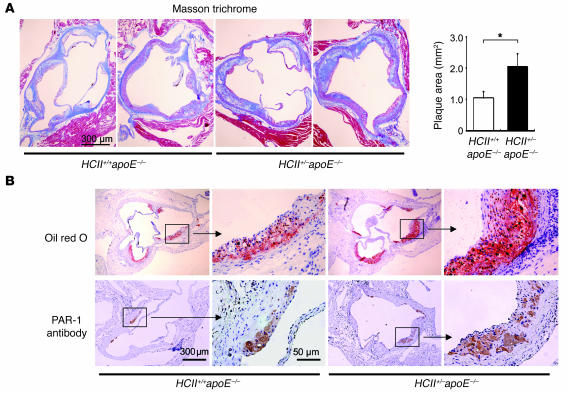
Figure 10. Quantification and characterization of atherosclerotic lesions in HCII+/+apoE–/– and HCII+/–apoE–/– mice.
(A) The left panel shows representative histological findings in Masson trichrome–stained serial sections of the aortic root in HCII+/+apoE–/– and HCII+/–apoE–/– mice. The right panel shows mean values of the atherosclerotic plaque area in HCII+/+apoE–/– (white bar) and HCII+/–apoE–/– mice (black bar). Values are expressed as mean ± SEM. *P < 0.05. n = 12 in each group. (B) Representative histological findings in oil red O– (upper panels) and PAR-1–stained (lower panels) serial sections of the aortic root in HCII+/+apoE–/– and HCII+/–apoE–/– mice.

