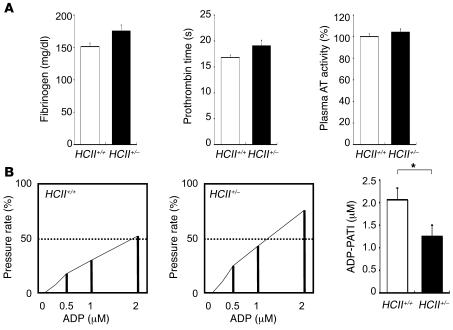
Figure 4. Effect of HCII deficiency on hemostatic examinations.
(A) Plasma fibrinogen concentration, prothrombin time, and AT activity in HCII+/+ (white bars) and HCII+/– mice (black bars). Values are expressed as mean ± SEM. n = 6–12 in each group. (B) The left and middle panels show representative results of platelet aggregation analyzed by the screen filtration pressure method in HCII+/+ and HCII+/– mice. The platelet aggregation pressure of each reaction tube was determined as the pressure rate (percentage). For screen filtration pressure aggregometer study, the pressure rate was standardized using a grading curve produced by plotting 3 concentrations of ADP on the x axis and pressure rate (percentage) on the y axis. The concentration of ADP causing a 50% increase in pressure rate was calculated and applied as the platelet aggregatory threshold index (PATI) in HCII+/+ (white bar) and HCII+/– mice (black bar). n = 6 in each group. Values are expressed as mean ± SEM. *P < 0.05.

