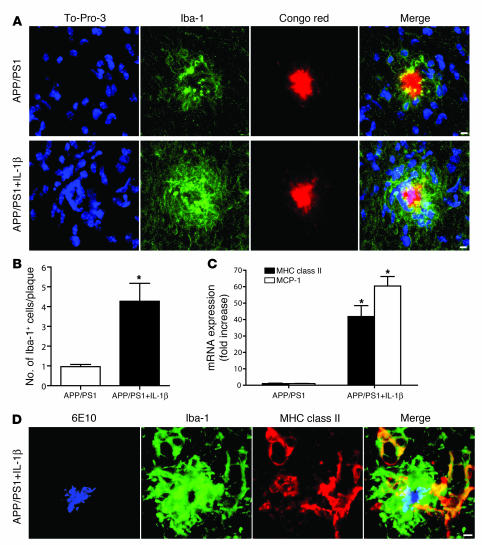
Figure 6. IL-1β driven microglial activation likely underlies reductions in plaque pathology.
Histological analysis was performed in 7-month-old APP/PS1 mice and APP/PS1+IL-1β mice 4 weeks following viral injections. (A) Confocal microscopy revealed an increase in Iba-1–positive (green) microglial cells (nuclei stained blue) directly in contact with Congophilic plaques (red) in APP/PS1+IL-1β mice compared with their APP/PS1 counterparts. (B) Quantitative analysis of mice in A revealed a greater than 4-fold increase in the number of Iba-1–positive cell nuclei overlapping Congophilic plaques. (C) qRT-PCR analysis showed robust upregulation of MHC class II and MCP-1 in APP/PS1+IL-1β mice compared with APP/PS1 mice. (D) 6E10 amyloid staining (blue) in conjunction with Iba-1 (green) and MHC class II (red) staining revealed activation of microglia in contact with amyloid plaque in an APP/PS1+IL-1β mouse. Scale bars: 5 μm. n = 6–7 per group. Data are mean ± SEM. *P < 0.05.

