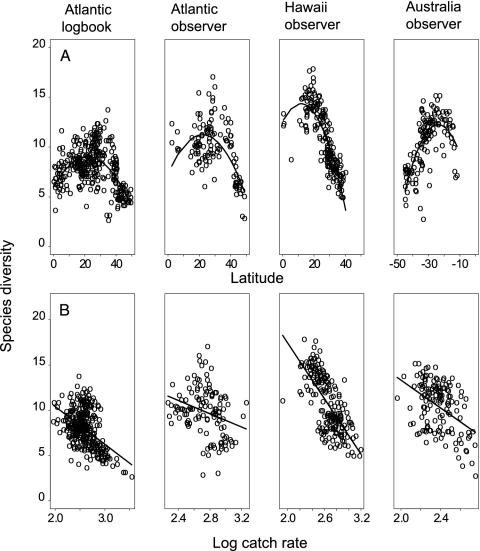
Fig. 3.
Relationships between predator diversity (species per 50 individuals) and latitude (A) and log catch rate (number of individuals per 10,000 hooks) (B). Lines indicate second-order polynomial (latitude) and linear regression (log catch rate) fits. Best fits were tested by using spatial regression models. In all cases the quadratic term shown in A and the linear term shown in B were highly significant (P < 0.001) with the exception of the northwest Atlantic observer data shown in B (P < 0.07).

