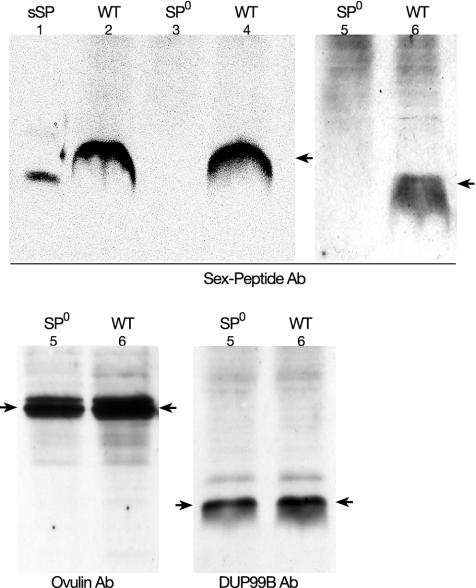
Fig. 3.
Western blots showing the expression patterns of SP, ovulin (ACP26Aa), and DUP99B in different stocks. The nature of the polyclonal antibody used as probes is indicated. The expected phenotype for SP (WT or SP0) is indicated at the top of the corresponding lanes. Ovulin and DUP99B are expressed independent of the presence or absence of the SP gene. The numbers indicate the nature or source of the samples: 1, synthetic SP (sSP); 2–6, genotypes of the accessory gland extracts; 2, SP+/SP+; 3, SP0/SP0; 4, SP0, SP+/SPΔ; 5, SP+/SPΔ; and 6, SP0, SP+/SP0. Arrows indicate SP, ovulin, and DUP99B, respectively.

