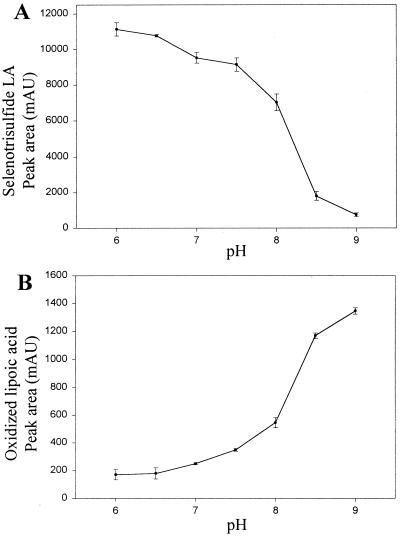
Figure 5.
pH stability of LASe. (A) Total area units of the peak representing LASe recorded during HPLC analysis are plotted as a function of the pH of the buffer in which LASe was incubated. (B) Total area units of the peak representing oxidized lipoic acid released from LASe are plotted as a function of the pH of the buffer in which LASe was incubated. The area units given in both plots are the average of at least three independent experiments, and the error bars represent one standard deviation from the mean. For LASe, the absorbance was followed at 288 nm, and for oxidized lipoic acid at 333 nm. Other experimental details are described in Materials and Methods.

