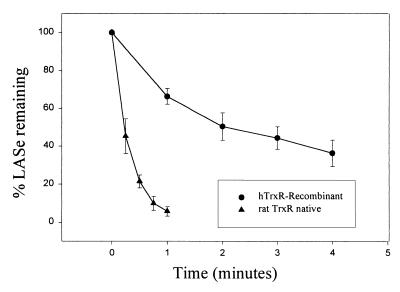
Figure 6.
Reduction of LASe by recombinant hTrxR and rat liver TrxR. Reaction mixtures (1 ml), containing 0.1 M sodium phosphate buffer (pH 7.0), 1.0 mM, and 300 μM LASe were incubated with recombinant hTrxR [1 μg, 4 units of activity with 5,5′ dithiobis(2-nitrobenzoic acid) as substrate] or native rat TrxR [1 μg, 42 units of activity with 5,5′ dithiobis(2-nitrobenzoic acid) as substrate]. Samples were taken at the indicated time intervals and stabilized for HPLC analysis by reaction with 200 mM iodoacetic acid. The area of the peak representing LASe determined for each time point by HPLC analysis was converted to a percentage of the initial LASe peak area of a sample taken before enzyme addition. The area units given in both plots are the average of at least three independent experiments, and the error bars represent one standard deviation from the mean.

