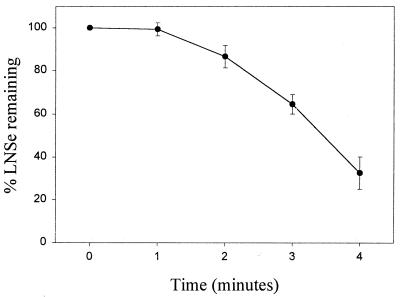
Figure 7.
Reduction of LNSe by bovine LD. Reaction mixtures contained 0.1 M sodium phosphate buffer (pH 6.5), 1.0 mM NADPH, 300 μM LNSe, and 33 ng LD. After removal of an initial aliquot before addition of enzyme, samples were taken at 1-min intervals up to 4 min. The area of the peak representing LNSe determined for each time point by HPLC analysis was converted to a percentage of the initial LNSe peak. The area units given are the average of at least three independent experiments, and the error bars represent one standard deviation from the mean.

