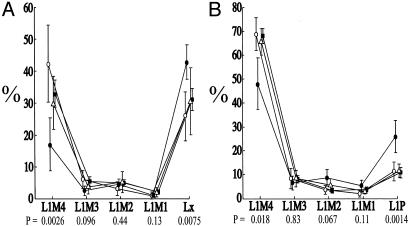
Fig. 4.
Distribution of LINE-1 ages between groups of genes. Plotted are the L1 subfamily mean percentages and their 95% confidence intervals. Below each LINE-1 type are P values across the corresponding values for the biallelic (white circle), imprinted (triangle), and random monoallelic (black circle) genes (Kruskal–Wallis test). Average (see Methods) for a random sample of 150 genes (squares). Mean percentages were calculated as the quotient of subfamily elements and total L1 elements. (A) Five mouse subfamilies are listed from the most ancient (L1M4) to the most recent (Lx). (B) Five human L1 subfamilies listed left to right from the evolutionarily most ancient (L1M4) repeats to the most recent (L1P). See supporting information for more details.

