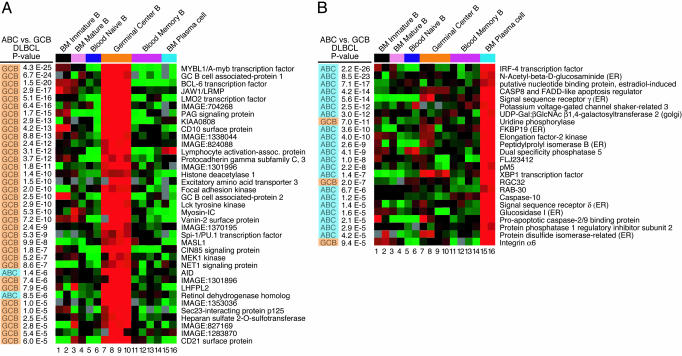
Fig. 2.
Relationship of gene expression in normal B cell subpopulations to DLBCL subgroups. Relative gene expression in the indicated purified B cell subpopulations (see Methods) is depicted according to the color scale in Fig. 1. The P value of the difference in expression of these genes between the GCB and ABC DLBCL subgroups is shown, and the subgroup with the higher expression is indicated (blue, ABC DLBCL; orange, GCB DLBCL). (A) DLBCL subgroup distinction genes that are more highly expressed in germinal center B cells than at other B cell differentiation stages. (B) DLBCL subgroup distinction genes that are more highly expressed in plasma cells than at other B cell differentiation stages.

