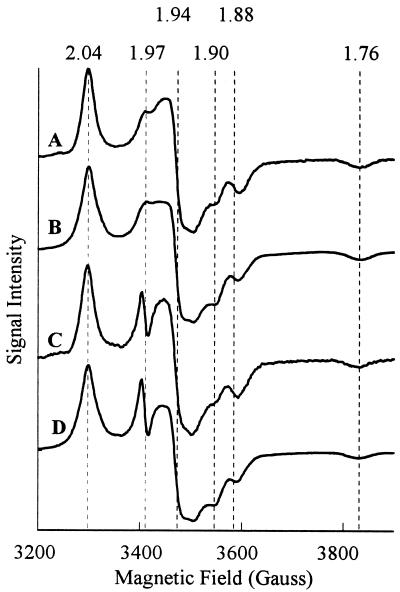
Figure 4.
10 K X-band EPR spectra of AcsAB. (A) CO-reduced (batch 2, 6.8 mg/ml), 0.05 mW microwave power; (B) Same as A, except 20 mW microwave power; (C) CO-reduced (batch 3, 4.6 mg/ml), 0.05 mW microwave power; (D) same as C, except 20 mW microwave power. Other conditions were as in Fig. 3.

