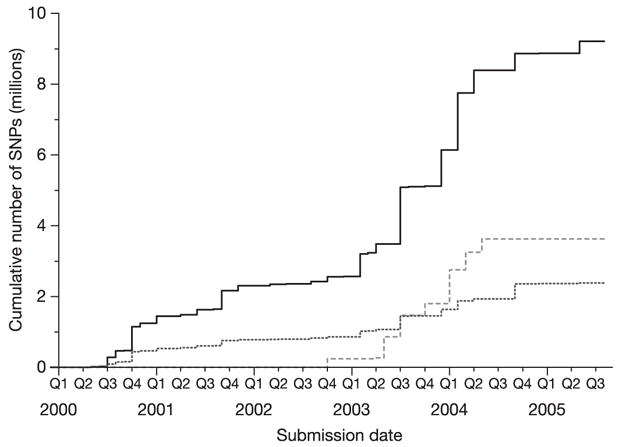
Figure 1. Number of SNPs in dbSNP over time.

The cumulative number of non-redundant SNPs (each mapped to a single location in the genome) is shown as a solid line, as well as the number of SNPs validated by genotyping (dotted line) and double-hit status (dashed line). Years are divided into quarters (Q1–Q4).
