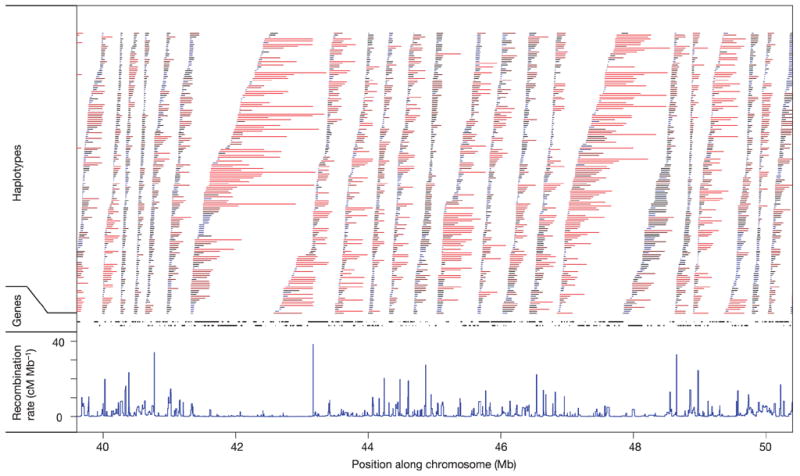
Figure 10. The relationship among recombination rates, haplotype lengths and gene locations.

Recombination rates in cM Mb−1 (blue). Non-redundant haplotypes with frequency of at least 5% in the combined sample (bars) and genes (black segments) are shown in an example gene-dense region of chromosome 19 (19q13). Haplotypes are coloured by the number of detectable recombination events they span, with red indicating many events and blue few.
