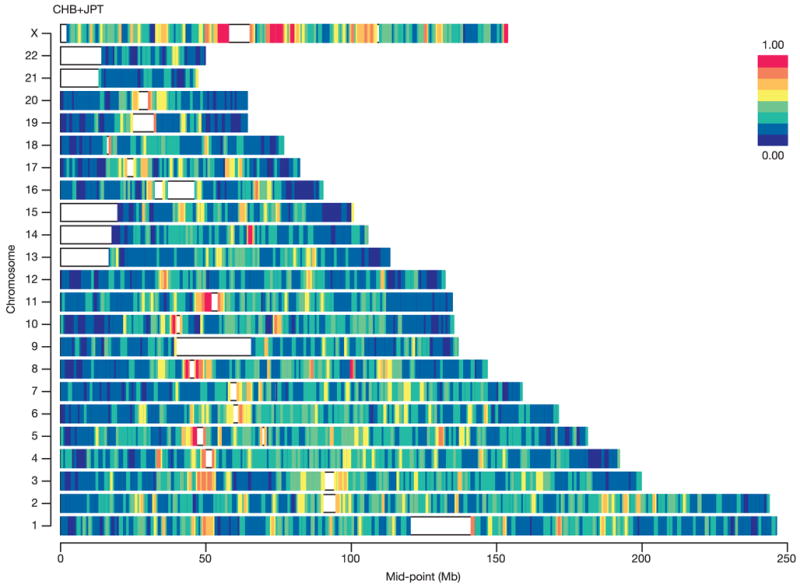
Figure 15. Length of LD spans.

We fitted a simple model for the decay of linkage disequilibrium103 to windows of 1 million bases distributed throughout the genome. The results of model fitting are summarized for the CHB+JPT analysis panel, by plotting the fitted r2 value for SNPs separated by 30 kb. The overall pattern of variation was very similar in the other analysis panels84 (see Supplementary Information).
