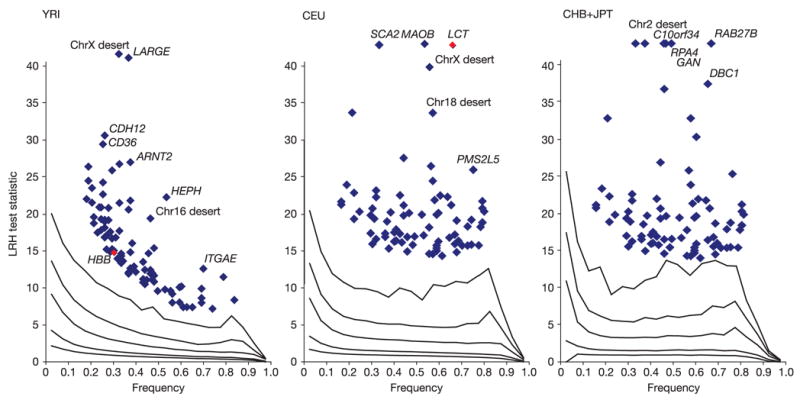
Figure 16. The distribution of the long range haplotype (LRH92) test statistic for natural selection.

In the YRI analysis panel, diversity around the HBB gene is highlighted by the red point. In the CEU analysis panel, diversity within the LCT gene region is similarly highlighted.
