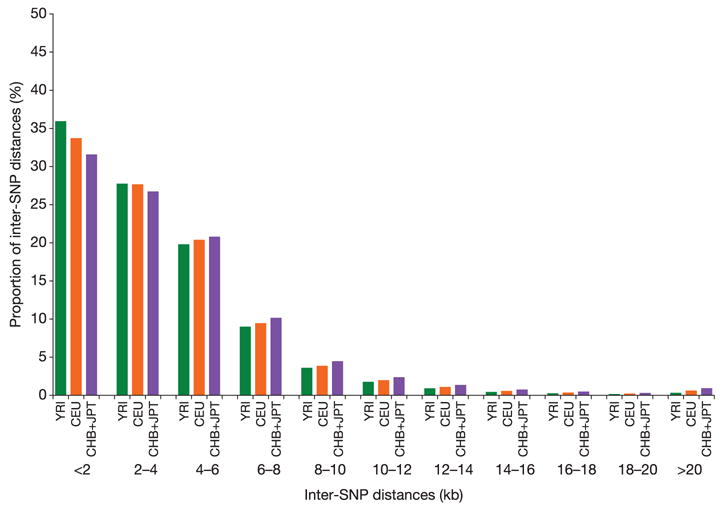
Figure 2. Distribution of inter-SNP distances.

The distributions are shown for each analysis panel for the HapMappable genome (defined in the Methods), for all common SNPs (with MAF ≥ 0.05).

The distributions are shown for each analysis panel for the HapMappable genome (defined in the Methods), for all common SNPs (with MAF ≥ 0.05).