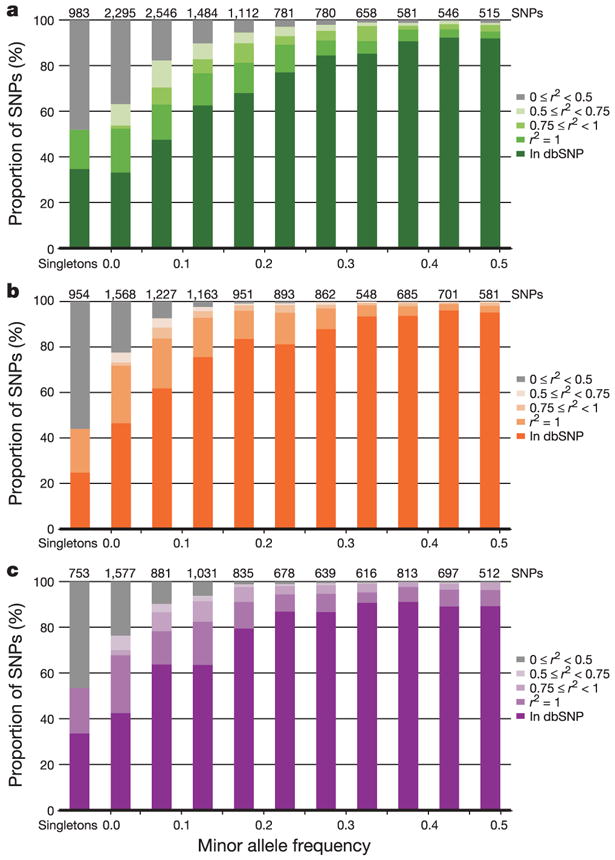
Figure 3. Allele frequency and completeness of dbSNP for the ENCODE regions.

a–c, The fraction of SNPs in dbSNP, or with a proxy in dbSNP, are shown as a function of minor allele frequency for each analysis panel (a, YRI; b, CEU; c, CHB+JPT). Singletons refer to heterozygotes observed in a single individual, and are broken out from other SNPs with MAF < 0.05. Because all ENCODE SNPs have been deposited in dbSNP, for this figure we define a SNP as ‘in dbSNP’ if it would be in dbSNP build 125 independent of the HapMap ENCODE resequencing project. All remaining SNPs (not in dbSNP) were discovered only by ENCODE resequencing; they are categorized by their correlation (r2) to those in dbSNP. Note that the number of SNPs in each frequency bin differs among analysis panels, because not all SNPs are polymorphic in all analysis panels.
