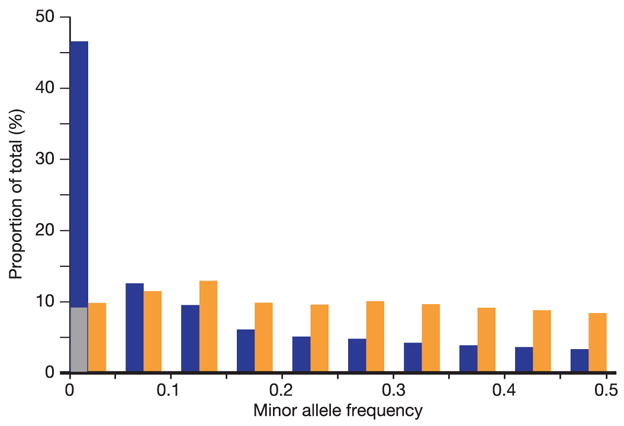
Figure 4. Minor allele frequency distribution of SNPs in the ENCODE data, and their contribution to heterozygosity.

This figure shows the polymorphic SNPs from the HapMap ENCODE regions according to minor allele frequency (blue), with the lowest minor allele frequency bin (<0.05) separated into singletons (SNPs heterozygous in one individual only, shown in grey) and SNPs with more than one heterozygous individual. For this analysis, MAF is averaged across the analysis panels. The sum of the contribution of each MAF bin to the overall heterozygosity of the ENCODE regions is also shown (orange).
