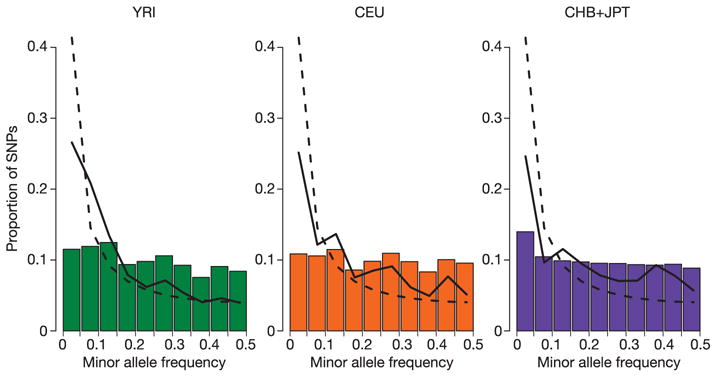
Figure 5. Allele frequency distributions for autosomal SNPs.

For each analysis panel we plotted (bars) the MAF distribution of all the Phase I SNPs with a frequency greater than zero. The solid line shows the MAF distribution for the ENCODE SNPs, and the dashed line shows the MAF distribution expected for the standard neutral population model with constant population size and random mating without ascertainment bias.
