Fig. 2.
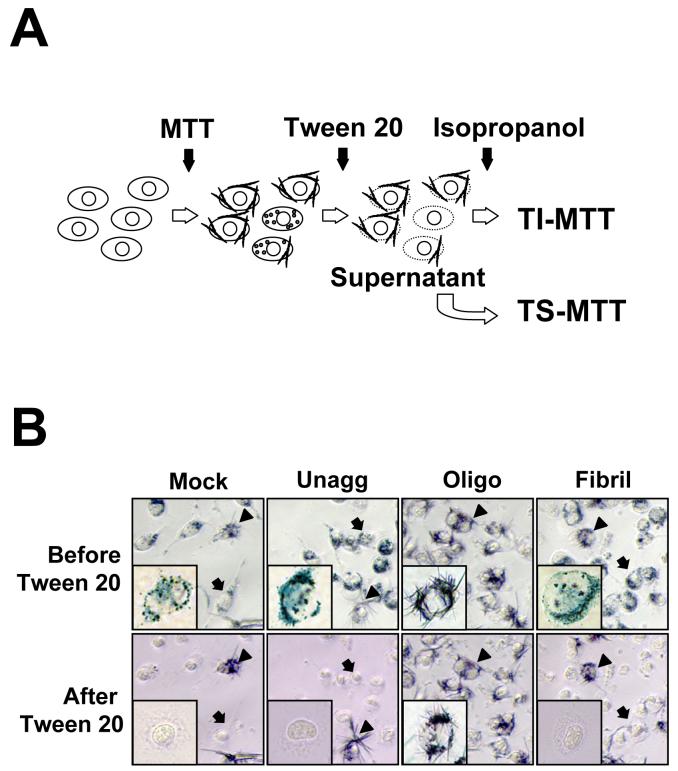
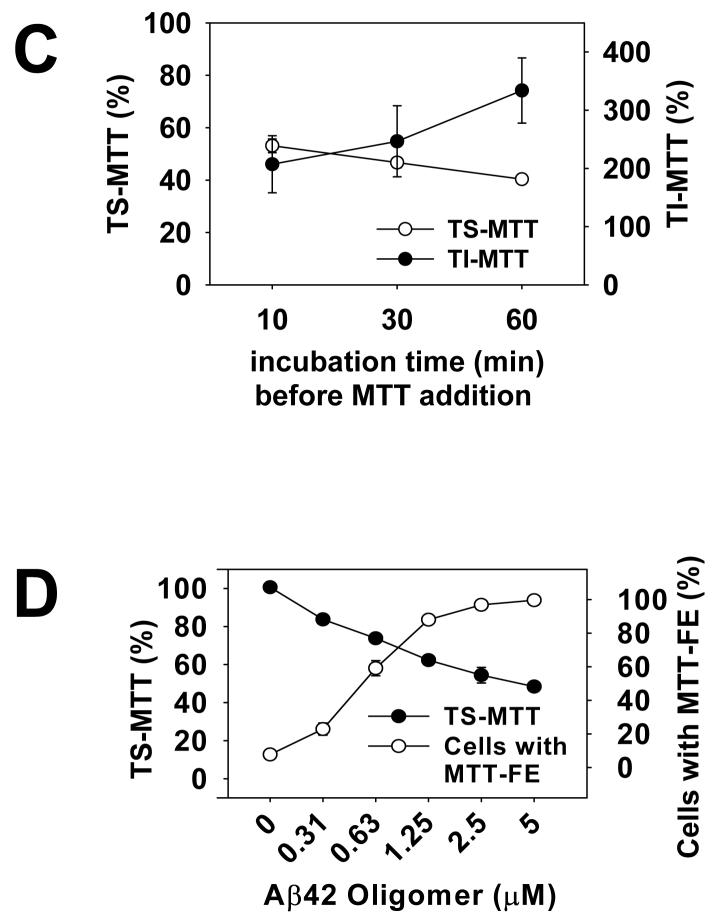
Sequential solubilization of intracellular MTT and exocytosed MTT. The panel A is a schematic of the method. Please see Experimental procedures for a description. The panel B shows photomicrographs of MTT-treated N2a cells, before (upper panel) and after (lower panel) Tween 20 extraction. Prior to the addition of MTT, cells were treated with solvent (Mock), or 2.5 μM unaggregated (Unagg), oligomeric (Oligo), and fibrillar (Fibril) Aβ42, respectively, for one hr. Arrows point to cells with intracellular granules that were completely solubilized by Tween 20 as the TS-MTT. Arrowheads point to cells with cell surface MTT crystals that were not solubilized by Tween 20. Representative cells from each condition are presented in the insets. Most cells in oligomers-treated cultures and a few cells in other cultures showed MTT formazan needles that were not dissolved by Tween 20, but were later dissolved by isopropanol as the TI-MTT. In panel C, N2a cells were treated with 2.5 μM Aβ42 oligomers as described in Fig. 1B. The levels of TS-MTT (empty circles) and TI-MTT (filled circles) were expressed as mean percentages with the mock treatment (DMSO solvent only) group set at 100%. Data presented are means from four independent experiments. Error bars represent standard error. In panel D, parallel sets of cells were treated with indicated concentrations of Aβ42 oligomers and the 2-hr protocol was performed. The levels of TS-MTT (filled circles), expressed as mean percentages with the mock treatment group set at 100%, were measured using one set of cells. Percentages of cells showing MTT-FE (open circles) were counted using the second set of cells. Data presented are means from 3 independent experiments. Error bars represent standard error.


