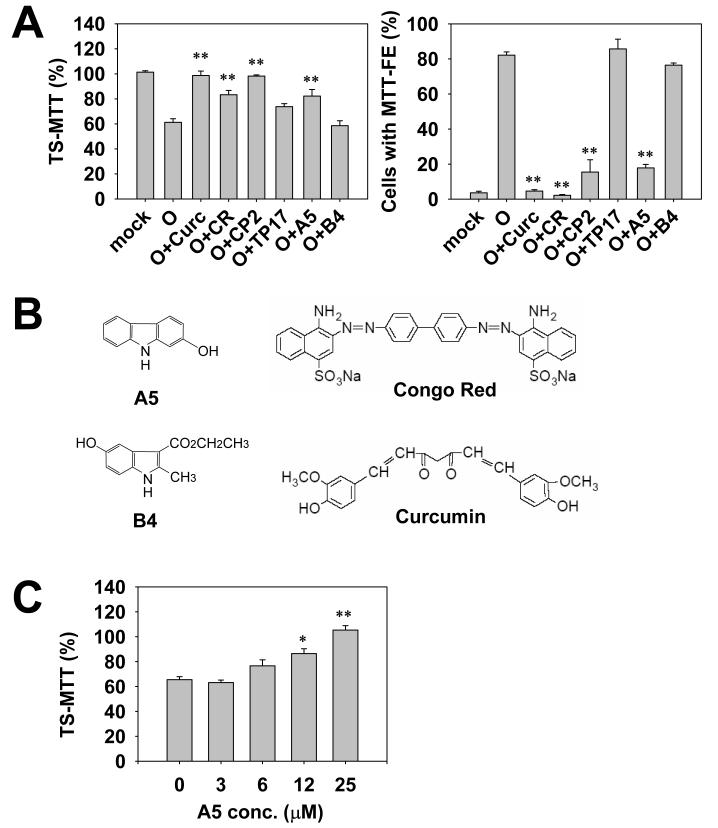
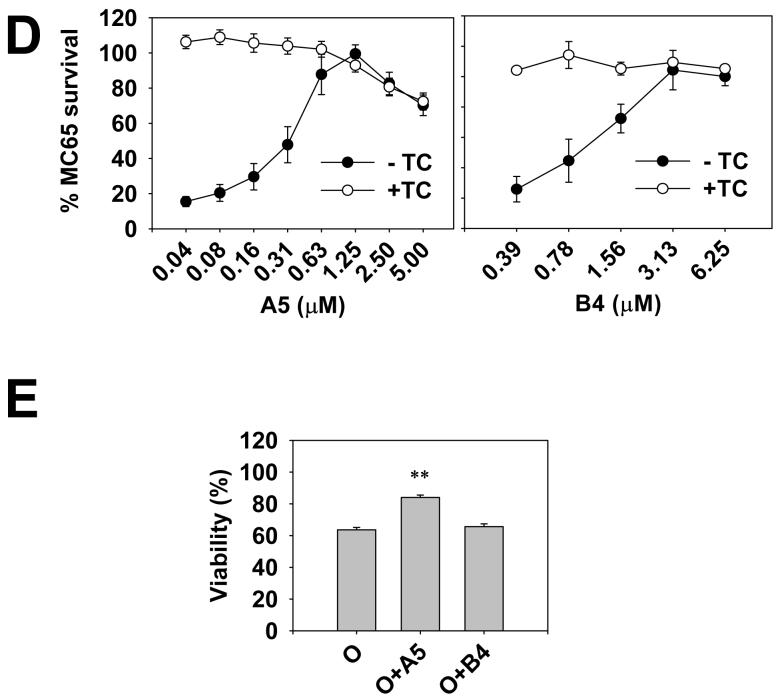
Fig. 3.
The selection of compounds using the rapid MTT-FE assay and the MC65 protection assay. Panel A shows that CR, curcumin, CP2 and A5 significantly antagonized the effect of oligomers, as demonstrated by the increase in TS-MTT and the decrease in the counts of cells with MTT-FE. Parallel sets of cells were treated with 2.5 μM Aβ42 oligomers in the absence or presence of indicated compounds (25 μM). The 2-hr protocol was performed. The levels of TS-MTT (left panel), expressed as mean percentages with the mock treatment (DMSO solvent only) group set at 100%, were measured using one set of cells. Percentages of cells showing MTT-FE (right panel) were counted using the second set of cells. Data presented are means from three independent experiments. Error bars represent standard error. ** p < 0.001, compared with oligomer treatment only (O) without compounds. Panel B shows the chemical structures of A5, B4, Congo red, and curcumin, which are not drawn to scale. Panel C shows the concentration-dependency of the A5 effect. The assay was performed as described in (A). Data presented are means from three independent experiments. Error bars represent standard error. * p < 0.01, and ** p < 0.001, compared with the no A5 group (0 μM). Panel D shows that both A5 (left panel) and B4 (right panel) protected MC65 cells in a concentration-dependent manner. The cell death program of MC65 cells was initiated by removal of the suppressor tetracycline (TC) to induce the expression of APP-C99 transgene. A5 and B4 of indicated concentrations were added at the same time as TC removal. At 72 hr, viability was assessed by the conventional MTT assay. Data are expressed as mean percentage viability (n = 3) with parallel +TC but no compound cultures set at 100% viability. Error bars represent standard error. Empty circles, +TC; and filled circles, −TC, in the presence of indicated concentrations of compounds. Panel E shows that A5, but not B4, blocked the Aβ42 oligomer-induced death of primary cortical neurons. Neurons (8 days in culture) were treated with 500 nM oligomers (O), or oligomers in the presence of 25 μM of A5 (O+A5) or B4 (O+B4). The mock treatment consisted of solvent (DMSO) only. After 48 hrs, the neuronal viability was measured using the conventional MTT method. Data are expressed as mean percentage viability with mock treatment controls set at 100% viability. Error bars represent standard error. n = 4, ** p < 0.001 compared to the oligomer-treated neurons (O).


