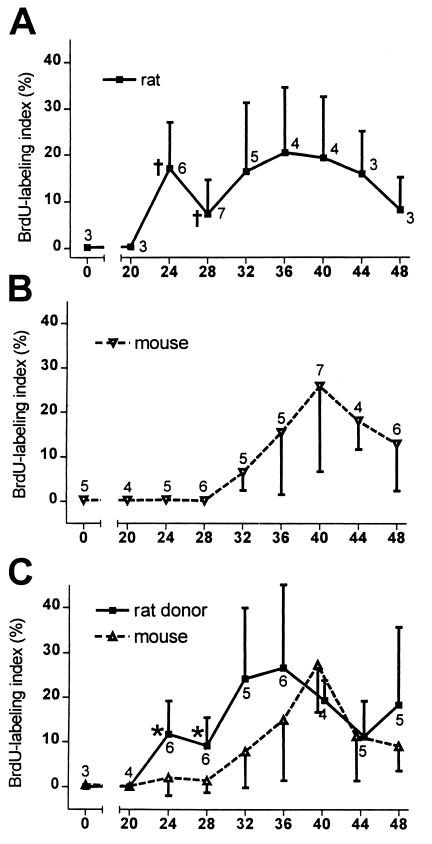
Figure 1.
Kinetics of BrdUrd-labeling in hepatocytes after two-thirds partial hepatectomy (mean ± standard deviation). (A) F344 rat livers, (B) nu/nu mouse livers. (C) MUP-uPA mouse chimeric livers repopulated with donor F344 rat hepatocytes. Number of animals at each time point is indicated on each plot. Statistical differences were identified by using the Mann–Whitney U test. For F344 rat cells versus nu/nu mouse cells, † = P < 0.009. For MUP-uPA endogenous mouse cells versus F344 donor rat hepatocytes in chimeric livers, *, P = 0.015. Data in B represent pooled results from nu/nu nontransgenic mice and nu/nu MUP-uPA transgenic mice that had not received hepatocyte transplants. Values for these groups were not statistically different.

