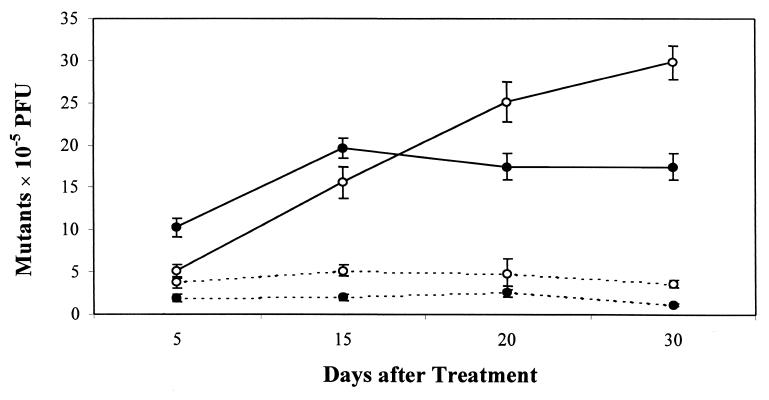
Figure 2.
Mutant frequencies (± standard error) in liver and testes from fish analyzed 5, 15, 20, or 30 days after 1-h exposure to 0 or 120 mg/liter ENU. Mutant frequencies in liver increased insignificantly over mean background (4.4 ± 0.7 × 10⁻⁵) at 5 days (5.1 ± 0.8 × 10⁻⁵), 4-fold at 15 days (15.6 ± 1.8 × 10⁻⁵), 6-fold at 20 days (25.1 ± 2.3 × 10⁻⁵), and 7-fold at 30 days (29.8 ± 2.0 × 10⁻⁵). Mutant frequencies in testes increased 5-fold over mean background (2.0 ± 0.6 × 10⁻⁵) at 5 days (10.3 ± 1.1 × 10⁻⁵), 10-fold at 15 days (19.6 ± 1.2 × 10⁻⁵), and 9-fold at 20 and 30 days (17.5 ± 1.6 × 10⁻⁵). –○–, ENU-exposed liver; –●–, ENU-exposed testes; - -○- - control liver; - -●- -, control testes.

