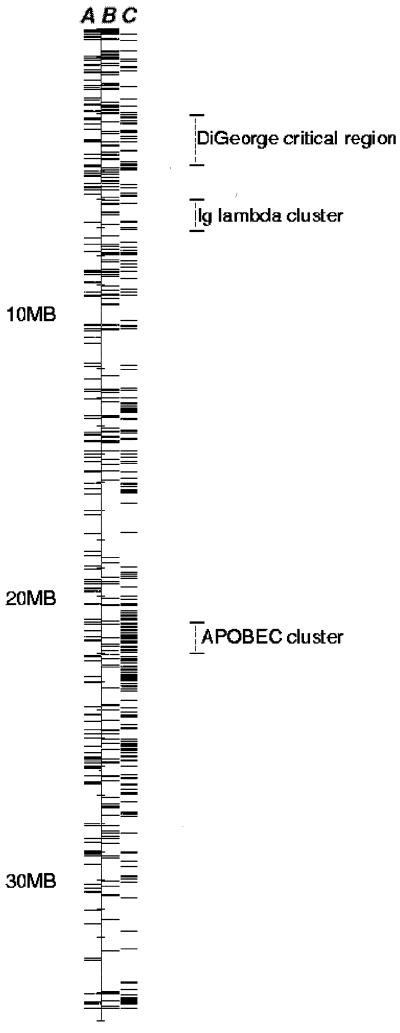
Figure 1.
Schematic diagram showing the relative position of known (B) and related and EST-predicted (C) genes as annotated by Dunham and colleagues (2). ORESTES-predicted transcribed regions identified in this report are shown in A. Marks in A–C represent only the initial position of genes and transcribed regions.

