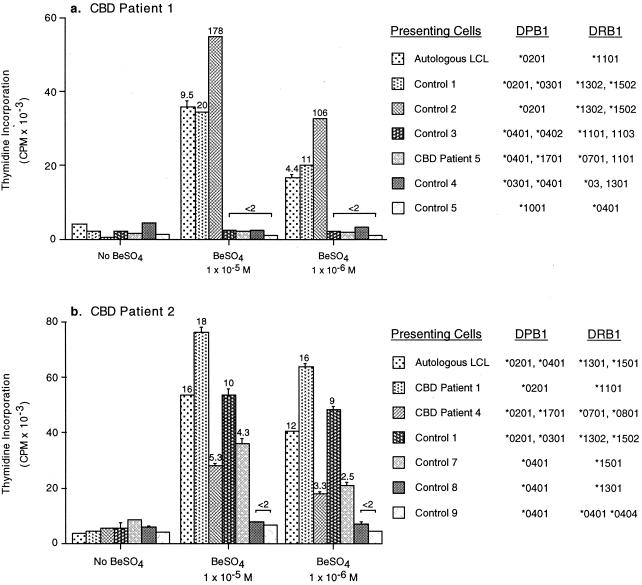
Figure 4.
Determination of the class II MHC allele restriction of BeSO4-specific T cell lines from (a) CBD patient 1 and (b) CBD patient 2. Stimulation of T cell lines was performed with autologous LCLs or allogeneic antigen-presenting cells in the presence of 1 × 10⁻⁵ M or 1 × 10⁻⁶ M BeSO4. The stimulation index for each of the various presenting cells is shown over each bar, and the molecular typing of the DPB1 and DRB1 alleles for each antigen-presenting cell is shown on the right. Data are expressed as the mean cpm ± SEM.

