
Figure 3.
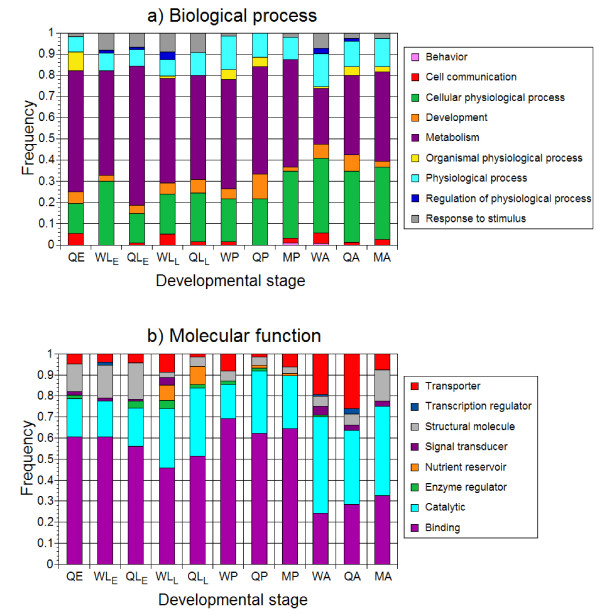
Proportion of transcripts from 11 cDNA libraries falling into different categories for (A) biological processes and (B) molecular function gene ontology. Q, queen; W, worker; M, male; E, egg; LE, early larval instars; LL, late larval instars; P, pupa; A, adult.