
Figure 2.
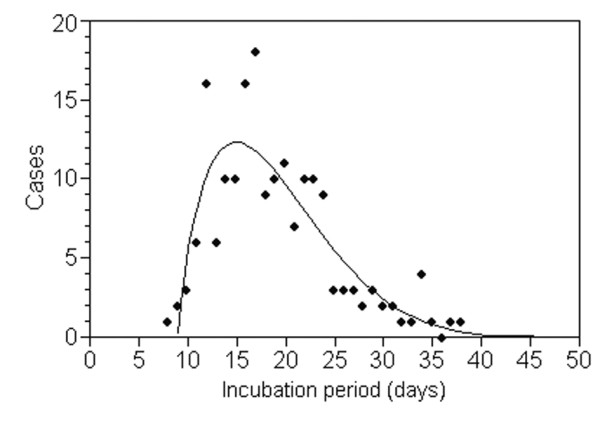
The incubation period distribution of typhoid fever in Old Salem Chautauqua, 1916, fitted to Pearson's Type I distribution. The incubation period started at an assumed time of exposure due to a flood that occurred 4 days before closing the water supply to Chautauqua. Since there were 4 possible days of exposure to contaminated water, the original study used the mid-point as a single time point of exposure. See [46] for the original descriptions.