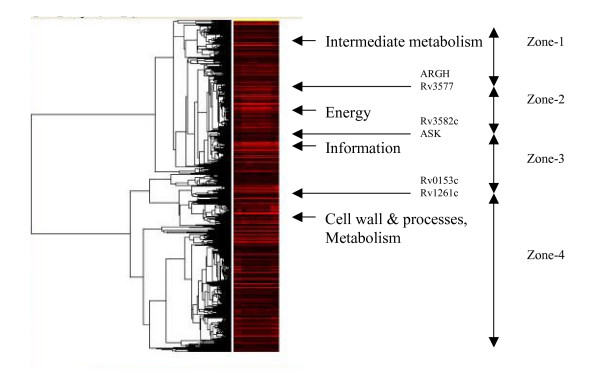
Figure 1.

The gene expression map of genes involved in the log-phase growth of Mycobacterium tuberculosis. The map was generated by Eisen's cluster-analysis program called CLUSTER and viewed by the TREEVIEW program. Several clusters representing aggregations of functionally related genes are visible in the dendrogram (on the left of the image) showing how genes are grouped. The detailed image is available at our web site [see Additional file 2] annotated with gene names alongside of the image strip [see Additional file 3].
