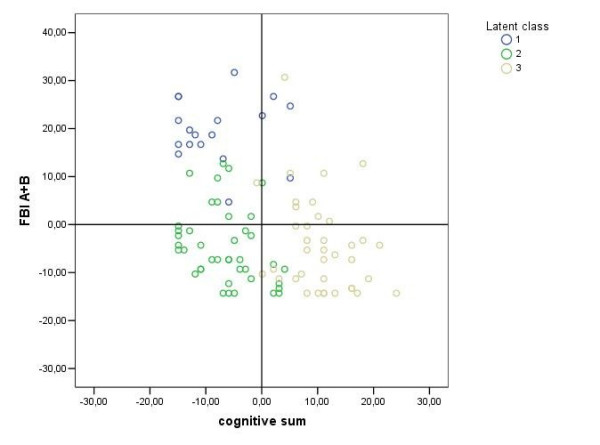
Figure 2.

Scatter-plot of FTLD patients labelled according to generated three Latent Classes. y axis: values of behavioural disturbances (measured by Frontal Behavioural Inventory Scale, FBI-A plus FBI-B,); x axis: values of cognitive deficits (cognitive sum, i.e. the sum of Equivalent Scores of all the neuropsychological tests included in the assessment, the higher the value the better the performance; see Table 4). The centroid (0;0) represents the overall mean profile; compared to the average value of the whole sample, LC1 patients have higher cognitive sum values (i.e. less severe cognitive impairment); while LC2 and LC3 patients have lower cognitive sum values (i.e. more severe cognitive impairment); vice versa the behavioural deficit values are higher in the LC1 than in the LC2 and LC3 patients.
