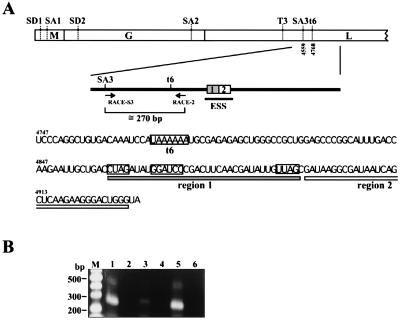
Figure 5.
Detection of a functional polyadenylation signal upstream of the ESS region. (A) Sequences of the BDV ESS region. Schematic map of BDV ORFs is shown at the top. Splice and polyadenylation sites of BDV are shown by bars. Primers for 3′RACE analysis and putative elements of BDV ESS are also indicated. A polyadenylation signal (t6) and possible motifs for ESS are boxed. (B) 3′RACE analysis of BDV. RNAs from BDV-infected cells were subjected to 3′RACE analysis by using the primers shown in A. lanes: M, marker; 1, MDCK/BDV cells; 2, MDCK cells; 3, C6BV cells; 4, C6 cells; 5, OL/BDV cells; 6, OL cells.

