

Abstract
Aims
For ethical and economic reasons, interim analysis of phase III clinical trials is essential. This study was conducted to compare the efficiency of two interim analysis procedures, which could be used to allow early termination of a clinical trial.
Methods
We made a post hoc application of two interim analysis methods (Lan & DeMets with O’Brien–Flemming modification, and the triangular test according to Whitehead) by using individual patient data from four published placebo-controlled survival trials. We determined the date the trial would have been stopped had each method been used, and we estimated consequent results in terms of events and patient numbers included in the trial, the duration of the trial, and on treatment effect.
Results
The triangular test provided the lowest number of events required to reach a conclusion of the trials while providing an accurate estimate of experimental treatment effects. The triangular test thus indicated the smallest number of patients that would have been enrolled, and the shortest trial duration. The difference between the methods was most important with a detrimental effect of experimental treatment: the number of required events was reduced by 75% and the trial duration was shortened by 48% with the triangular test compared to the Lan & DeMets method.
Conclusions
Stopping a trial early must depend on the clinical context. It is most important to stop a placebo-controlled trial as soon as possible when the experimental treatment can be shown deleterious. In such a situation the triangular test is more appropriate than the Lan & DeMets method. When a treatment effect is no different from, or better than, placebo the triangular test is also superior but the importance of premature termination of the trial in such cases has to be balanced against the inevitable reduction of information that the trial can provide.
Keywords: Controlled clinical trials, clinical trials data monitoring committees, trial design, interim analysis, sequential methods, triangular test
Introduction
Phase III clinical trials evaluate the benefit of a new treatment. To plan a clinical study, which will achieve this with a specified power, several parameters such as the rate of events in the control group and the expected benefit from the experimental treatment need to be estimated [1]. Because of the approximate nature of such estimates in the trial design it is necessary that data are subjected to frequent analysis to ensure the validity and the safety of an on-going trial [2]. Such monitoring provides opportunities to re-evaluate assumptions for the sample size [3], and also gives an early estimate of the experimental treatment effect. Interim findings could lead to an early termination of the trial and thus prevent unnecessary exposure of patients to inferior treatment, or avoid delays in identifying a superior treatment with a benefit greater than expected. Thus several recent trials have been terminated prematurely for either benefit (HOPE study [4]), or harm of an experimental therapy (ALLHAT study [5]). However, because of the increase of the false-positive α error rate induced by repeated analyses of accumulating data [6], interim results must be interpreted using a specific stopping rule [7]. Several procedures for interim analysis have been proposed [8–11] but methods of monitoring a trial are not widely agreed. In large-scale clinical trials interim safety and efficacy evaluation is usually based on the ‘α-spending function’ as described by Lan & DeMets [10] with a conventional conservative boundary type. This approach applies the rate of spending the α error during the trial until its planned end. The ‘stopping rules’ are then based on the level of observed P-value at the time of interim analysis.
With the triangular test [11] several assumptions, including the α-error rate, are used to define the rules that will guide the monitoring of the trial. Although some phase III clinical trials [12, 13] had been planned using the triangular test, this method remains widely under-used. However, mathematical simulations [14, 15] have shown that the triangular test seems to be a highly effective method of reducing the sample size and duration of a trial. How effective the triangular test is in the real conditions for clinic trial remains unclear.
Therefore in order to evaluate the potential value of the triangular test and the planning and monitoring of phase III placebo-controlled survival trials in comparison with other methods, we compared the triangular test and the Lan & DeMets method retrospectively to four published trials using their original data.
Methods
Sequential procedures
Repeated significance testing approach according to Lan & DeMets
In this approach, a nominal significance level α′ < α is used at each analysis in order to maintain the predetermined overall significance level α. Various adjustment strategies have been proposed. Lan and DeMets developed the ‘α-spending function’ [10], which defines a continuous increasing function characterizing the rate the α error is ‘spent’ according to the progress of the trial (Figure 1a). This progress is defined according to the number of expected events at the time of trial design. The calculations of nominal significance levels depend upon the predetermined two-sided overall α error rate, the total number of analyses, and the boundary shape parameter, which defines the likelihood of stopping at the early stage as opposed to the late stages of the trial. In this study, the boundary shape parameter is set to zero corresponding to the popular and validated O’Brien and Flemming modifications.
Figure 1.
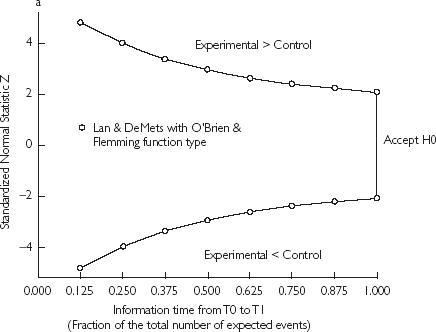
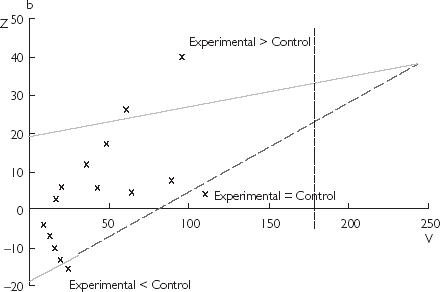
(a) Two-sided graphical representation of the critical values according to the α-spending function with O’Brien–Flemming-type. The global α is fixed to 0.05 and 8 analyses were planned. (b) Triangular design with the three possible conclusions according to the crossing boundary. The vertical dotted line represents the information equivalent to the fixed sample design. It plays no role in the procedure and is only reported here for comparison.
Boundaries approach: the triangular test
The triangular test, developed by Whitehead from initial work of Wald and Anderson, uses a sequential plan defined by two perpendicular axes corresponding to two several statistics Z and V. The statistic Z (vertical axis) summarizes the current difference between the experimental treatment and control. The statistic V (horizontal axis) represents the quantity of information accumulated since the beginning of the trial [11]. It reflects both the cumulated number of patients and the number of observed events, and it will thus increase as the study progresses.
Two straight lines intersect and define an asymmetric triangular area with two external stopping boundaries. At each interim analysis, the two statistics Z and V are calculated from the accumulated data and define a point reported on the sequential plan. The consecutive points plot a sample path going from the left to the right. The study is continued as long as the sample path stays within the two boundaries and is stopped when one of the boundaries is crossed. The conclusion of the study depends on, which boundary is crossed (Figure 1b): experimental better than control for the upper boundary, experimental nondifferent or inferior to control for the lower boundary. The equations of each boundary are specific for a trial and depend on prespecified α (two-sided) and β error rates, on the expected benefit of the experimental treatment over control and on the expected rate of events in the control group of the study. Furthermore, after each interim analysis, boundaries are adjusted thus defining a continuation region with a shape of a Christmas tree. Such adjustment maintains the α error risk at its prespecified level when study starts.
Reanalysed clinical trials
Four published phase III clinical trials were reanalysed in this study. Table 1 shows their main characteristics: their duration (calculated between the first inclusion and the final analysis, which lead to stopping the trial), and the final results on the difference between the experimental treatment effect and control. All these trials are recent multicentre randomized, double-blind and placebo-controlled trials. For all of them, all-cause mortality was the primary end-point. It was expressed as survival time (censored criterion).
Table 1.
Published characteristics of the re-analysed clinical trials
| Study | Trial duration (days) | No. of patients | Hazard Ratio (%95CI) | p |
|---|---|---|---|---|
| CIBIS II Bisoprolol vs placebo in chronic heart failure | 829 | 2647 | 0.66 (0.54–0.81) | 0.0001 |
| EMIAT Amiodarone vs placebo in post-MI | 1795 | 1486 | 0.99 (0.76–1.31) | 0.96 |
| PRIME II Ibopamine vs placebo in chronic heart failure | 1066 | 1906 | 1.26 (1.04–1.53) | 0.017 |
| CIBIS I Bisoprolol vs placebo in chronic heart failure | 1442 | 641 | 0.80 (0.56–1.15) | 0.8 |
These trials represent a sample of the different conclusions that a phase III clinical trial may reach. One trial (CIBIS II [16]) demonstrated a benefit of experimental treatment, one (EMIAT [17]) showed no significant difference between treatments, one (PRIME II [18]) was stopped because of a deleterious effect of the experimental treatment and one (CIBIS I [19]) was underpowered.
For each trial, the initial hypothesis on the two-sided α error rate and the power (1-β), the expected benefit of the experimental treatment over control and the expected rate of events in the control group were observed from the protocol (Table 2). Using this information, the sequential design according to the two studied methods was rebuilt for each trial.
Table 2.
Initial hypothesis used for the rebuilding of sequential designs
| Study | α (two-sided) | Power (1-β) | Expected rate of events in control group | Hazard ratio for the difference between treatments |
|---|---|---|---|---|
| CIBIS II | 0.05 | 0.95 | Annual mortality rate: 0.112 | 0.75 |
| EMIAT | 0.05 | 0.8 | 2-year mortality rate: 0.15 | 0.65 |
| PRIME II | 0.05 | 0.8 | Annual mortality rate: 0.2 | 0.75 |
| CIBIS I | 0.05 | 0.9 | 2-year mortality rate: 0.37 | 0.67 |
Interim analyses planning
For each method, interim analyses were performed according to the total number of expected deaths in a trial. With the triangular test, analyses started after 10% of the number of expected deaths (minimum 40 events) then each 5% with a minimum of 20 events between each analyses. With the Lan & DeMets method, analyses were performed after 25%, 37.5%, 50%, 62.5%, 75%, 87.5% and 100% according to Lan & DeMets recommendations [20].
Re-analysis of trials
The individual data for each trial were set on SAS (SAS Institute, Cary, USA) or EXCEL (Microsoft Corp.) files and included for each patient the date of inclusion, the treatment code and the event code with its date if occurred. Thus, the real progress of each trial was rebuilt and the two interim analyses procedures were applied. For each method, the date the trial would have been stopped was then determined.
Statistical analysis
Statistical analyses were computed using the SAS v6.12 software. The monitoring and the sequential analyses using the triangular test were performed with the Planning and Evaluation of Sequential Trials (PEST 4.0) statistical software [21]. The Lan & DeMets method was performed with the EAST software [22].
Differences in survival between treatments were assessed using the log-rank test. Hazard ratios and 95%CI were calculated with Cox's proportional hazards regression model at the date of stopping decision provided by each methods. For the triangular test, PEST 4.0 software provides corrected hazard ratios taking into account the sequential nature of analyses [11].
Results
Figure 2 shows the design and the monitoring of each trial with the triangular test. The number of events and patients enrolled at the stopping time for each method are reported in Table 3. The triangular test provides the shortest sizes and durations for all the re-analysed trials except for the underpowered CIBIS I study.
Figure 2.
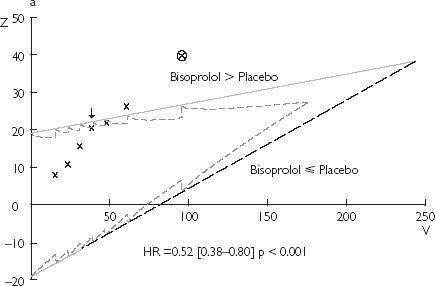
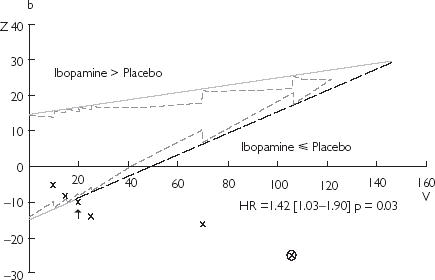
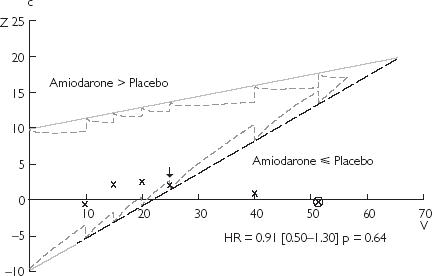
Results of the monitoring of clinical trials using the triangular test: (a) CIBIS 2; (b) PRIME 2; (c) EMIAT. The black arrow points the stopping time provided by this method. The estimation of the experimental treatment effect (hazard ratio and P-value) at this time is reported on each design. The circled cross corresponds to the report on the design of the real final analysis. HR = hazard ratio
Table 3.
Number of events and of enrolled patients at the time of stopping decision according to each interim analyses procedures
| Triangular test | Lan & DeMets | |||
|---|---|---|---|---|
| Events (Exp/Control) | No. of patients | Events (Exp/Control) | No. of patients | |
| CIBIS II | 157 (58/99) | 2416 | 314 (129/185) | 2647 |
| EMIAT | 100 (48/52) | 960 | – | – |
| PRIME II | 80 (49/31) | 522 | 340 (187/153) | 1570 |
| CIBIS I | 120 (53/67) | 641 | 120 (53/67) | 641 |
Exp, experimental.
Trial showing benefit of the experimental treatment: CIBIS II
With the triangular test, the fourth interim analysis (25% of the expected death) reached the upper boundary, which would have led to stopping the trial prematurely for a significant benefit of bisoprolol over placebo (Figure 2). A total number of 157 events would have been necessary to reach this conclusion with the triangular test instead of 314 (50% of expected deaths) with the Lan & DeMets method. The early stopping provided by the triangular test would have reduced the number of enrolled patients by 9% compared to the Lan & DeMets method. Despite the lower number of events with the triangular test, the estimation of the bisoprolol effect on mortality (Figure 2) remains correct compared to the published result. The trial duration of the CIBIS II study would have been reduced by 30% with the triangular test compared to the Lan & DeMets method: 517 days vs 738 days, respectively.
Trial showing no significant differences between experimental and control: EMIAT
Because of the low number of expected events (about 200 deaths), the first interim analysis was performed after 40 deaths (20%) then each 20 deaths (10%) with the triangular test. At the fourth interim analysis (50% of expected death), the lower boundary is crossed (Figure 2) in its dashed part and the trial would have been stopped for lack of difference between amiodarone and placebo on mortality in postmyocardial infarction. 931 days would have been necessary to reach this conclusion. The hazard ratio for the effect of amiodarone stays consistent with the value later published (Figure 2). Had the trial been stopped then 35% less patients would have been enrolled. Unlike the triangular test, the Lan & DeMets method does not provide stopping rules for the early acceptation of the null hypothesis (meaning the lack of significant difference between treatments). Thus, no early termination of this trial could have been observed using the Lan & DeMets method.
Trial showing a deleterious effect of the experimental treatment: PRIME II
With the triangular test, the third interim analysis (20% of the expected death) crosses the lower boundary in its solid part and would stop the trial because of inferiority of ibopamine compared with control on mortality in chronic heart failure (hazard ratio on Figure 2). The Lan & DeMets method would have also provided an earlier detection of such detrimental effect but need a four fold higher number of events than the triangular test to demonstrate this effect. Thus, the number of enrolled patients was reduced by 66% (522 vs 1570) and the trial duration by 48% (486 days vs 950 days) with the triangular test compared to the Lan & DeMets method.
Underpowered trial: CIBIS I
The lower-than-expected mortality rate largely reduced the power of the study: the mortality rate in the placebo group was expected to be between 36 and 38% but was actually only 21%. Using both the interim analysis methods, no early termination of the study would have been advised. In this under-powered study, the triangular test would have lead to continuation of the study at the time of final analysis (20% of the expected number of deaths) as no boundary had been crossed. The Lan & DeMets method based on an information fraction related to the expected deaths would have lead to the same conclusion.
Report of later oservations in the triangular test
In Figure 2, the points following the first crossing of a boundary (stopping time) provided by the triangular test (black arrow) correspond to the further information provided by the real data (the circled cross represents the real final analysis). In all trials, extra information confirms the consistency of the earlier decision. In these trials, the sample path keeps the same direction and all further points remain in the same side of triangle boundaries.
Discussion
This study addressed the potential advantages and limits of the sequential approach for the monitoring of phase III placebo-controlled survival trials, and was based on a retrospective analysis of four trials using their individual data. Our results show that the triangular test method provides an early determination of the experimental treatment effect whatever it may be. However, the importance of such a premature detection of treatment effect depends on the actual results observed.
The largest reduction in sample size and trial duration was detected when the experimental treatment did not show any benefit compared with placebo, and this is a major advantage of the triangular test. In survival trials there is a need to use formal interim analysis procedures, which monitor both efficacy and safety of the new therapy [23]. It is also desirable to stop the trial as soon as it is clear that the experimental treatment is not better, and even more so if it appears detrimental. The two-sided but asymmetric conception of the triangular design and the lower boundary double × meaning [24] (Figure 1b) appear optimally adapted for this.
The very early detection of the deleterious effect of a new treatment compared to placebo provided by the triangular test (as in the PRIME II study) is of considerable practical and ethical importance. The Lan & DeMets method, which is widely used in large-scale clinical trial (e.g. GUSTO V study [25]), provides symmetric boundaries for early detection of treatment differences. Our results show that the detection of a deleterious effect in the PRIME II study would have occurred with this method about one year later than with the triangular test. However, ethical reasons justify asymmetric stopping rules, since early termination for safety reasons should require less secure evidence than efficacy. Peto's rule [26], which assigns a fixed minimized α′ (at 0.001 for efficacy) for each interim analysis was used in the PRIME II study, where α′ was adjusted to 0.01 for safety. Compared with this well-accepted adjustment technique, the triangular test would have led to an earlier stopping of this trial. In contrast with the ‘α-spending function’ approach, the stopping rules provided by the triangular test are not only based on the P-value but also include the expected value of the experimental treatment benefit. Thus, at the very early time of stopping decision allowed by the triangular test in the PRIME II study, the P-value for the difference between treatment is 0.03 but the experimental treatment clearly showed no benefit. The difference between stopping rules for detrimental effect according to each method is well shown in the Figure 3 where both methods are represented on same scales for a same trial. One could wonder if the investigators would have really stopped the trial at the early date supported by the triangular test with so few patients, so few events and a P-value of 0.03?? In the case of the PRIME II study later observations proved the triangular test to be right.
Figure 3.
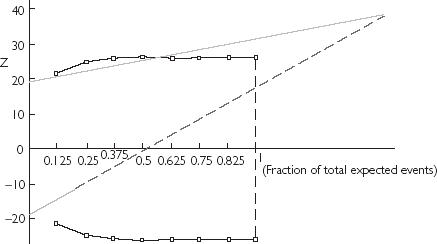
Graphical comparison of both interim analysis methods reported on same scales. The horizontal axis represents the information time according to the expected number of expected events and the vertical axis, the current difference between treatments. The dotted (light grey) and broken ( ) lines draw the triangular test boundaries and the black lines (with □) represent the boundaries according to the Lan & DeMets method.
Similarly, the earliest detection of a lack of efficacy of the experimental treatment in the EMIAT trial was provided by the triangular test. While several trials have been stopped early for harm from experimental therapy [5, 18], early stopping for lack of difference between the experimental and the control treatments remains rare [12]. In contrast with the triangular test, the Lan & DeMets method does not provide rules to stop a trial early when there is a lack of difference between treatments. A design, which allows early stopping for accepting the null hypothesis can be however, implemented with the EAST software [22] and its application to the EMIAT study would have provided the same stopping time as with the triangular test (data not shown). However, one has to keep in mind that the boundary for lack of difference between treatments depends on the expected benefit for the experimental therapy and that interpretation of such results has to be cautious. The EMIAT study failed to demonstrate an expected 35% reduction of mortality in the amiodarone group but amiodarone was found to reduce the total mortality by 13% in the Amiodarone Trials Meta-Analysis, which included 6553 patients [27]. Thus the EMIAT study was underpowered to demonstrate this lower benefit, and the early stopping of the trial would have reduced this power even more. Under such circumstances the use of the triangular test could warn the investigators that the objective of the trial is unlikely to be reached. However, the decision to stop such a trial should remain the responsibility of an independent data committee, which will take into account the clinical context.
On the other hand the value of the earliest possible detection of experimental treatment benefit is not necessarily an over-riding priority. The CIBIS II study was prematurely stopped using a Peto's rule [26]. However, the triangular test would have provided an earlier stopping time than was indicated with either the Peto's rule or the Lan & DeMets method. This would have led to an important reduction in the information about the mechanism of the benefit and about secondary endpoints. A trial that has demonstrated benefit from a new treatment will not be repeated. It will inevitably lead to wide-scale use of the new drug, and as much information as possible must be derived from the trial about the drugs efficacy and safety in patient subgroups. Trials showing an unexpected benefit from an experimental treatment must not therefore be stopped early simply on statistical grounds: such practical problems have been previously discussed [28, 29].
In our study, interim analyses were planned according to the total number of expected deaths. The frequency of analysis seems to have no influence on the statistical properties of the triangular test [15]. The planning of interim analyses after each 5% of the expected deaths was chosen for pragmatic reasons including feasibility and validity. Interim analyses were less frequent with the Lan & DeMets method as it has been showed that the times for these would be chosen independently of the behaviour of the sample path [20]. The application of identical interim analysis planning for both methods would not have changed our results.
The stopping rules for the triangular test were based here on a single crossing of a boundary. The consistent crossing of a boundary by several analyses before a stopping decision would be required as in the HOPE study [4]. Such a requirement would not have changed our conclusions.
Several other methods have been described for the ‘repeated significance approach’. We chose here the Lan & DeMets method because of its ‘α-spending function’ flexibility [30] and its wide and accepted use in large-scale clinical trials. Several types of ‘α-spending function’ have been described ranging from the conservative O’Brien–Flemming type to the more aggressive Pocock type. We chose the O’Brien–Flemming variety because of the lower risk of α-error rate inflation if underlying assumptions were incorrect or if there was an increase in the frequency of the analyses [15, 31].
Our study inevitably has limitations. We made a retrospective application of interim analyses methods to real clinical trials. These trials are finished, published, and would not have used the triangular test when they were conducted. Our results are therefore not critical of those trials, but aim to improve planning and methodology of trials in future. An essential prerequisite for a successful application of such methods lies in the assurance of an accurate and swift reporting of events. The retrospective application of methods of interim analysis in our work was based on complete and validated data and this is seldom possible when interim analyses are performed. Planning data management becomes more important if interim analyses are made more efficient. First, the minimization of delays is necessary whatever procedure is used [32]. Second, there is no need for complete reports and only essential details such as treatment code, prognostic factors, date of inclusion and date of death required. Such data could be processed separately and rapidly communicated to the safety committee.
Finally, the decision to stop a study early involves ethical, administrative, economic and not just statistical, consideration. Statistics should be considered as a tool, which could trigger the procedure to stop a trial but statistics cannot supplant a trial safety committee.
In conclusion, the sequential approach based on the triangular test appears to be a useful methodological tool to assist in the planning and monitoring of placebo-controlled survival trials. Its major advantage lies in the early detection of lack of benefit of the experimental treatment compared to placebo, especially when the experimental treatment is detrimental. However, the use of this or any other approach must depend on the clinical context and the relevance of early trial terminations.
Acknowledgments
We thank Sanofi Synthelabo (France) and Merck Darmstadt (Germany) for their collaboration. Jean-Sébastien Hulot was supported by a grant from the French Federation of Cardiology. J.-S. Hulot collected the data, implemented the methods, analysed the results and wrote the paper with the help of Ph. Lechat and J. Hampton. J.-S. Hulot and Ph. Lechat designed the study. M. Cucherat, A. Charlesworth, A. Mallet and J.-P. Boissel provided assistance in statistical calculations and interim methods application. Ph. Lechat, J. Hampton, Dirk J. Van Veldhuisen and M. Cucherat provided the data. J.-C. Corvol helped in the data analysis and preparation of the paper. All the authors were involved in data interpretation, reviewed the paper and approved its final version.
References
- 1.Friedman L, Furberg C, DeMets L. St Louis: Mosby Year Book; 1996. Fundamentals of clinical trial. [Google Scholar]
- 2.A report from the Heart Special Project Committee to the National Advisory Heart Council. Organization, review and administration of cooperative studies (Greenberg Report) Control Clin Trials. 1988;9:137–148. doi: 10.1016/0197-2456(88)90034-7. [DOI] [PubMed] [Google Scholar]
- 3.Gould AL. Sample size re-estimation: recent developments and practical considerations. Stat Med. 2001;20:2625–2643. doi: 10.1002/sim.733. [DOI] [PubMed] [Google Scholar]
- 4.The Heart Outcomes Prevention Evaluation Study Investigators. Effects of an angiotensin-converting-enzyme inhibitor, ramipril on cardiovascular events in high-risk patients. N Engl J Med. 2000;342(3):145–153. doi: 10.1056/NEJM200001203420301. [DOI] [PubMed] [Google Scholar]
- 5.The Antihypertensive and Lipid-Lowering Treatment to Prevent Heart Attack Trial (ALLHAT) Officers and Coordinators for the ALLHAT Collaborative Research Group. Major cardiovascular events in hypertensive patients randomized to doxazosin vs chlorthalidone. JAMA. 2000;283:1967–1975. [PubMed] [Google Scholar]
- 6.Armitage P, McPherson CK, Rowe BC. Repeated significance tests on accumulating data. J R Stat Soc A. 1969;132:235–244. [Google Scholar]
- 7.Todd S, Whitehead A, Stallard N, Whitehead J. Interim analyses and sequential designs in phase III studies. Br J Clin Pharmacol. 2001;51:394–399. doi: 10.1046/j.1365-2125.2001.01382.x. [DOI] [PMC free article] [PubMed] [Google Scholar]
- 8.Pocock S. Group sequential methods in the design and analysis of clinical trials. Biometrika. 1977;64(2):191–199. [Google Scholar]
- 9.O'Brien P, Flemming T. A multiple testing procedure for clinical trials. Biometrics. 1979;35:549–556. [PubMed] [Google Scholar]
- 10.Lan KG, DeMets D. Discrete sequential boundaries for clinical trials. Biometrika. 1983;70(3):659–663. [Google Scholar]
- 11.Whitehead J. The Design and Analysis of Sequential Clinical Trials. 2. Chichester: John Wiley & Sons Ltd; 1997. revised. [Google Scholar]
- 12.Boden W, Van Gilst W, Scheldewaert R, et al. for the Incomplete Infarction Trial of European Research Collaborators Evaluating Prognosis post-Thrombolysis (INTERCEPT) Diltiazem in acute myocardial infarction treated with thrombolytic agents: a randomised placebo-controlled trial. Lancet. 2000;355:1751–1756. doi: 10.1016/s0140-6736(00)02262-5. [DOI] [PubMed] [Google Scholar]
- 13.Moss A, Jackson Hall W, Cannom D for the Multicenter Automatic Defibrillator Implantation Trial Investigators (MADIT) Improved survival with an implanted defibrillator in patients with coronary disease at high risk for ventricular arrhythmia. N Engl J Med. 1996;335:1933–1940. doi: 10.1056/NEJM199612263352601. [DOI] [PubMed] [Google Scholar]
- 14.Benichou J, Chastang C. A simulation study of three sequential methods for the comparison of two treatment groups when the response criterion is censored. Stat Med. 1986;5:375–385. doi: 10.1002/sim.4780050410. [DOI] [PubMed] [Google Scholar]
- 15.Sebille V, Bellissant E. Comparison of four sequential methods allowing for early stopping of comparative clinical trials. Clin Sci. 2000;98:569–578. [PubMed] [Google Scholar]
- 16.CIBIS-II, Investigators and Committees. The Cardiac Insufficiency Bisoprolol Study II (CIBIS-II): a randomised trial. Lancet. 1999;353:9–13. [PubMed] [Google Scholar]
- 17.Julian DG, Camm AJ, Frangin G, et al. for the European Myocardial Infarct Amiodarone Trial Investigators. Randomised trial of effect of amiodarone on mortality in patients with left-ventricular dysfunction after recent myocardial infarction. EMIAT Lancet. 1997;349:667–674. doi: 10.1016/s0140-6736(96)09145-3. [DOI] [PubMed] [Google Scholar]
- 18.Hampton JR, Van Veldhuisen DJ, Kleber FX, et al. for the Second Prospective Randomised study of Ibopamine on Mortality and Efficacy (PRIME II) Randomised study of effect of ibopamine on survival in patients with advanced severe heart failure. Lancet. 1997;349:971–977. doi: 10.1016/s0140-6736(96)10488-8. [DOI] [PubMed] [Google Scholar]
- 19.CIBIS Investigators and Committees. A randomized trial of beta-blockade in heart failure. The Cardiac Insufficiency Bisoprolol Study (CIBIS) Circulation. 1994;90:1765–1773. doi: 10.1161/01.cir.90.4.1765. [DOI] [PubMed] [Google Scholar]
- 20.Lan KG, DeMets D. Changing frequency in interim analysis in sequential monitoring. Biometrics. 1989;45:1017–1020. [PubMed] [Google Scholar]
- 21.Medical and Pharmaceutical Statistics Research Unit. Planning and Evaluation of Sequential Trials (PEST) 40. Reading: Medical and Pharmaceutical Statistics Research Unit; 2000. [Google Scholar]
- 22.Cytel Software Corporation. EaSt Cambridge: Cytel Software Corporation; 1992. [Google Scholar]
- 23.Department of Health and Human Services. Guidance on statistical principles for clinical trials. International Conference on Harmonisation, September 16, 1998. 1998. Food and Drug Administration Federal Register.
- 24.Whitehead J. Sequential methods based on the boundaries approach for the clinical comparison of survival times. Stat Med. 1994;13:1357–1368. doi: 10.1002/sim.4780131310. [DOI] [PubMed] [Google Scholar]
- 25.The GUSTO V Investigators. Reperfusion therapy for acute myocardial infarction with fibrinolytic therapy or combination reduced fibrinolytic therapy and platelet glycoprotein IIb/IIIa inhibition: the GUSTO V randomised trial. Lancet. 2001;357:1905–1914. doi: 10.1016/s0140-6736(00)05059-5. [DOI] [PubMed] [Google Scholar]
- 26.Peto R, Pike MC, Armitage P, et al. Design and analysis of randomized clinical trials requiring prolonged observation of each patient I. Introduction and design. Br J Cancer. 1976;34:585–612. doi: 10.1038/bjc.1976.220. [DOI] [PMC free article] [PubMed] [Google Scholar]
- 27.Amiodarone Trials Meta-Analysis Investigators. Effect of prophylactic amiodarone on mortality after acute myocardial infarction and in congestive heart failure: meta-analysis of individual data from 6500 patients in randomised trials. Lancet. 1997;350:1417–1424. [PubMed] [Google Scholar]
- 28.Pignon JP, Tarayre M, Auquier A, et al. Triangular test and randomized trials: practical problems in a small cell lung cancer trial. Stat Med. 1994;13:1415–1421. doi: 10.1002/sim.4780131317. [DOI] [PubMed] [Google Scholar]
- 29.Yusuf S, Collins R, Peto R. Why do we need some large, simple randomized trials. Stat Med. 1984;3:409–420. doi: 10.1002/sim.4780030421. [DOI] [PubMed] [Google Scholar]
- 30.DeMets D, Lan KG. Interim analysis: the alpha spending function approach. Stat Med. 1994;13:1341–1352. doi: 10.1002/sim.4780131308. [DOI] [PubMed] [Google Scholar]
- 31.Proschan M, Follmann D, Waclawiw M. Effects of assumption violations on type I error rate in group sequential monitoring. Biometrics. 1992;48:1131–1143. [Google Scholar]
- 32.Flemming TR, DeMets D. Monitoring of clinical trials. Control Clin Trials. 1993;14:183–197. doi: 10.1016/0197-2456(93)90002-u. [DOI] [PubMed] [Google Scholar]