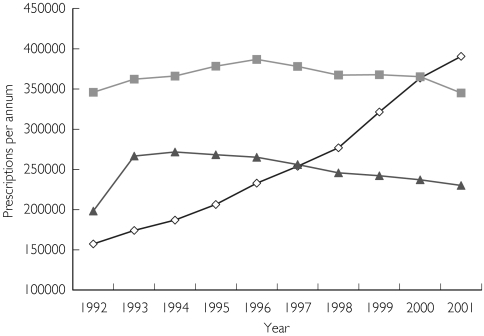
Figure 2.
Figure 2 Prescription data: Graph showing the number of prescriptions per annum (in Australia) for each of the anticonvulsants (⋄, valproate;  , carbamazepine; ▴, phenytoin). There are no easily available data for 1991 and the data for 2001 are only available up to October 2001. Thus, numbers for 2001 were multiplied by 12/10 to correct for this.

