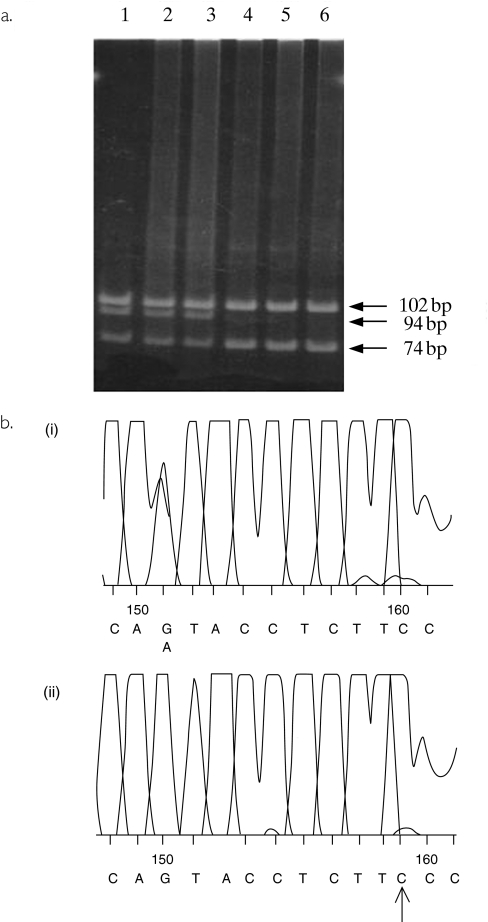
Figure 1.
(a) Polyacrylamide gel electrophoresis of digested PCR products. Lanes 1–3 show band patterns for samples with a CYP3A5*1/CYP3A5*3 genotype. Lanes 4–6 show band patterns for samples from subjects with a CYP3A5*3/CYP3A5*3 genotype. (b) Sequencing traces of PCR products from samples positive and negative for CYP3A5*1. Panel (i) shows a trace from a sample from a subject with the genotype CYP3A5*1/CYP3A5*3 and panel (ii) a CYP3A5*3/CYP3A5*3 genotype. The mismatched primer has resulted in the introduction of C in place of T in the forward sequence which is indicated by an arrow.

