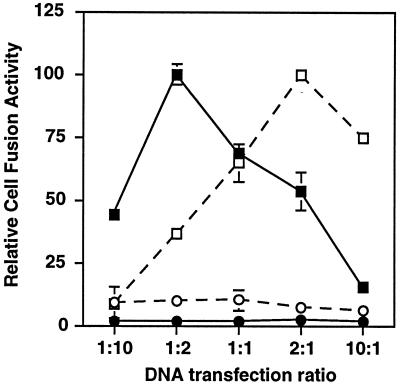
Figure 3.
Effect of DNA transfection ratio on complementation efficiency. The Env DNA transfection ratios were varied, keeping total amount of DNA at 5 μg. Ratios are shown for SF162-FP:SF162-BS (closed symbols) and SF162-FP:LAV (open symbols). Target cells expressed CD4 and either CCR5 (squares) or no coreceptor (circles). Error bars indicate the standard errors of the mean of duplicate samples.

