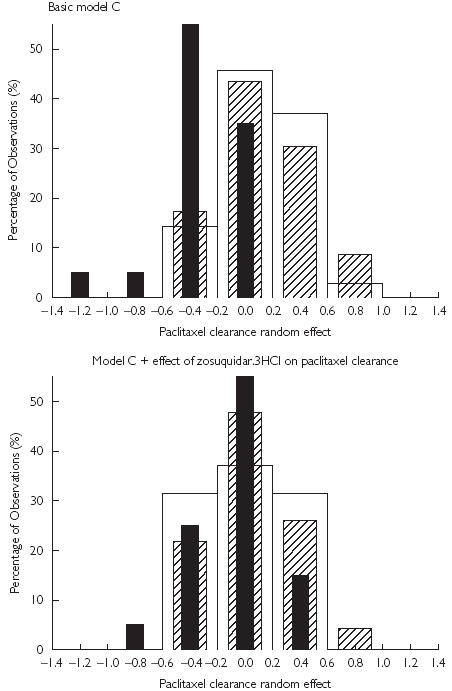
Figure 3.

Distribution of paclitaxel clearance random effect estimated from the basic model C (top panel) and the model accounting for the influence of zosuquidar on paclitaxel clearance (lower panel). The difference in the thickness of the bars is for illustrative purposes only. In absence of zosuquidar.3HCl (□); in presence of zosuquidar.3HCl (Cmax ≤ 350 µg/L) ( ); and in presence of zosuquidar.3HCl (Cmax > 350 µg/L) (▪).
