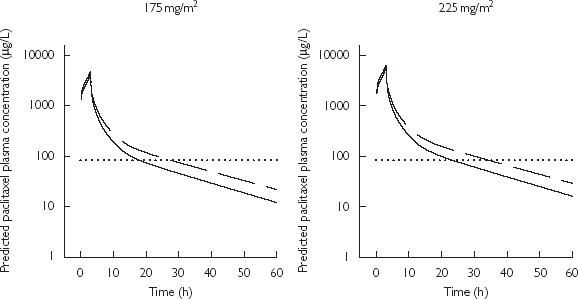
Figure 5.

Median paclitaxel simulated plasma concentrations vs time profile following a 3 h i.v. administration of 175 mg m−2 (left panel) and 225 mg m−2 (right panel) in the absence or presence of zosuquidar (Cmax≤ 350 µg l−1) (solid line) and the presence of zosuquidar (Cmax > 350 µg l−1) (dashed line); Dotted line highlights paclitaxel concentrations of 0.1 µM (84 µg l−1)
