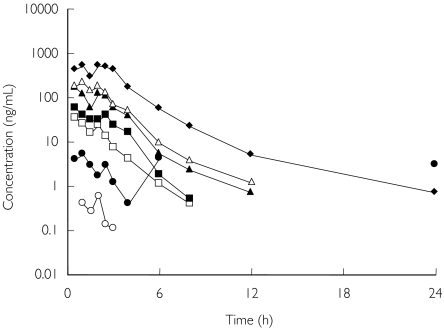
Figure 1.
Time course of plasma omapatrilat concentration after single doses of the drug. The tmax for omapatrilat was ≤ 2.25 h for all doses. Mean results are presented for each dose group. Note that the relatively high mean plasma concentration at 6 and 24 h after the 7.5 mg dose is due to one single outlier subject (data points: 6 h: 25.3 ng ml−1; 24 h: 18.0 ng ml−1). 2.5 mg (○); 7.5 mg (•); 25 mg (□); 50 mg (▪); 125 mg (▴); 250 mg (▵); and 500 mg (♦).

