
Figure 1.
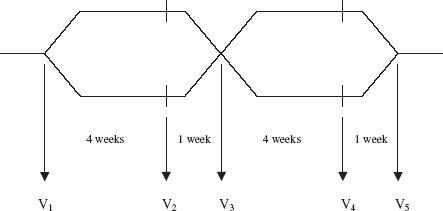
Study flow diagram. Patients had baseline measurements on the first study visit (V1) on their usual ICS therapy and were then randomized to receive either BUD + FM for 4 weeks followed by the same dose of BUD for 1 week, or FP + SM for 4 weeks followed by the same dose of FP for 1 week. Patients then crossed over to the other randomized treatment arm. Measurements were taken at V1– V5