
Fig. 3.
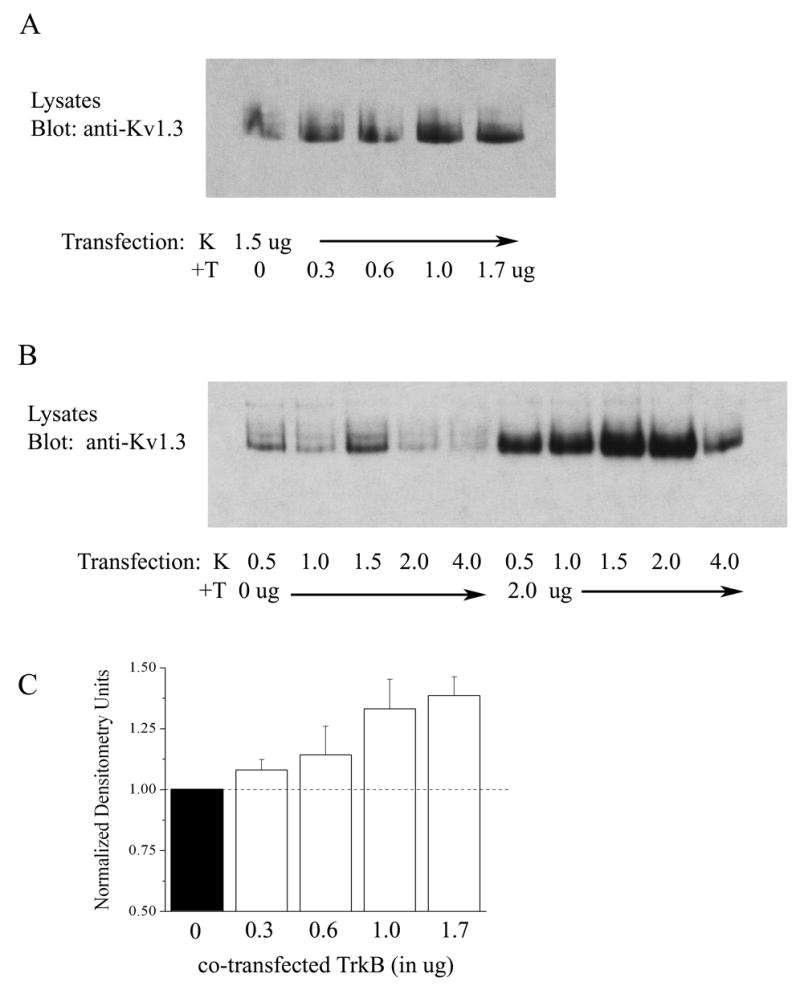
Dose-dependent upregulation of Kv1.3 protein expression in the presence of TrkB. (A) HEK293 cells were transiently transfected with cDNA encoding Kv1.3 (K) plus increasing concentrations of TrkB (+T) ranging from 0 to 1.7 μg. Lysates were prepared and separated by SDS PAGE as in Fig. 1. Nitrocellulose was blotted with anti-Kv1.3. Gel is representative of three such experiments testing increasing transfection concentrations of TrkB. (B) As in (A) but varying transfection concentrations of Kv1.3 cDNA in the absence (0 μg) and presence (2.0 μg) of a fixed concentration of TrkB (+T) cDNA. (C) Histogram plot of the mean ± standard error of the mean (s.e.m.) normalized immunodensity values for 3 such experiments demonstrated in A. Pixel density ratios (dashed line) were generated by normalizing each value with that of the density for control K transfection using 0 μg TrkB cDNA.