
Fig. 6.
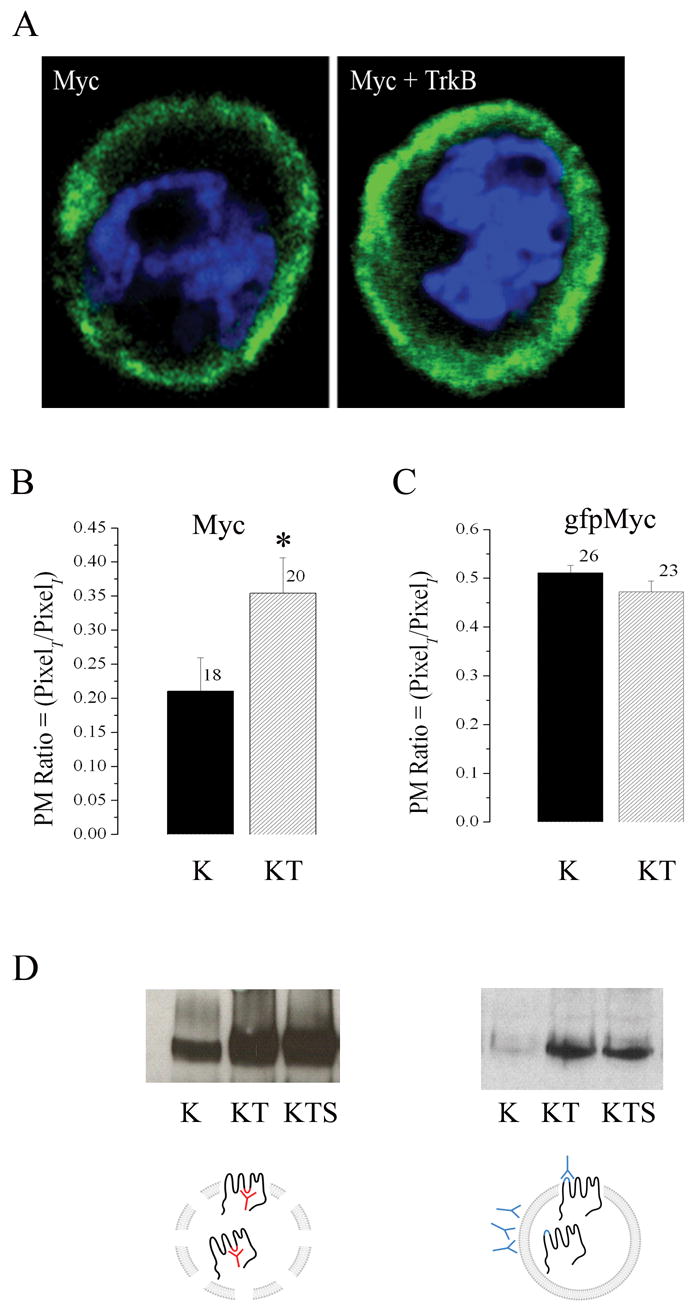
TrkB co-expression increases surface distribution of Kv1.3 channel. (A) Representative HEK 293 cell transiently transfected with myc tagged Kv1.3 (Myc) alone or plus TrkB (Myc + TrkB). Channel protein was detected by incubation with anti-myc under non-permeabilizing conditions and then visualized with species appropriate fluorescent-conjugated secondary antiserum (green). Cells were also stained with DAPi (blue) to visualize the nuclei and general integrity of the cells. Stacks of confocal images were acquired and projected as a z-series. (B–C) Pixel immunodensity was calculated (see text) for the Myc and gfpMyc Kv1.3 constructs under K and KT transfection conditions using blind assessment of a population of cells across multiple plates and transfection batches. Histogram represented data are expressed as mean ± s.e.m., sample size as indicated, * = Statistically significant by Student’s t-test at α≤ 0.05. (D) HEK293 cells were either transiently transfected (LEFT PANEL) with cDNA encoding Kv1.3 (K), Kv1.3 plus TrkB (KT), or Kv1.3, TrkB, and the adaptor protein Shc (KTS) or the same series of constructs (RIGHT PANEL) substituting MycKv1.3 construct for untagged Kv1.3. Lysates were either immunoprecipitated (IP) with an antiserum to Kv1.3 (anti-Kv1.3) as previously described (LEFT PANEL SCHEMATIC), or surface labeled as live cells with anti-Myc prior to cell lysis (RIGHT PANEL SCHEMATIC. Both preparations were separated by SDS PAGE and nitrocellulose was probed with anti-Kv1.3 as in Fig. 1. Autoradiographs are representative of four such experiments.