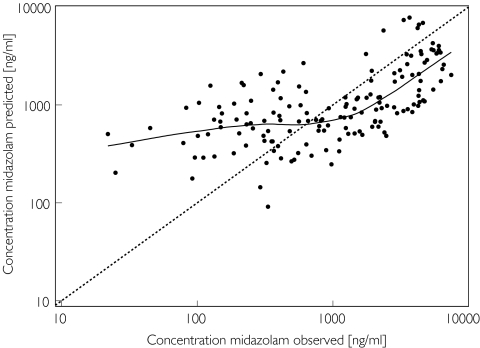
Figure 4.
Individual Bayesian midazolam concentrations in the evaluation group predicted by the two-compartment covariate-adjusted model vs the corresponding observed concentrations, superimposed on the line of identity (broken line) and a nonparametric smooth fit with a Loess spline function (solid line)

