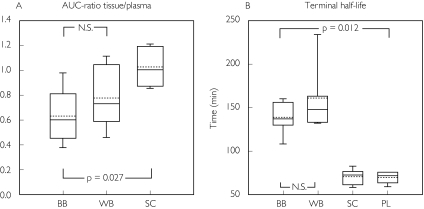
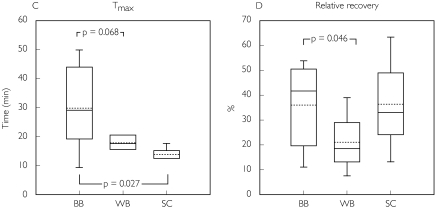
Figure 2.
Box plots demonstrating median (solid centre line), mean value (dotted centre line), 25th and 75th percentile (lower and upper box limit), and 5th and 95th percentile (error bars) for morphine pharmacokinetics and the relative recovery in patients with traumatic brain injury. The values were obtained by microdialysis in ‘better’ brain tissue (BB), ‘worse’ brain tissue (WB) and in subcutaneous adipose tissue (SC). The plasma (PL) data were obtained by regular blood sampling


